
Landing page benchmarks
How to Increase Your Conversion Rate (With Benchmarks From 13,000+ Pages)
See real conversion rates from 13,000+ pages, broken down by industry and page type. Use these benchmarks to set a target and increase your conversion rate.
You increase conversion rate by knowing what “good” looks like for your industry and page type, then testing changes that move that number. The figures here come from aggregated, anonymized data across more than 13,000 pages published with Leadpages. Use them to set a baseline, spot gaps, and focus your optimization.
Leadpages data
Conversion rates for pages published with Leadpages, by industry and page type
more than 13,000 published pagesAs of November 16, 2026
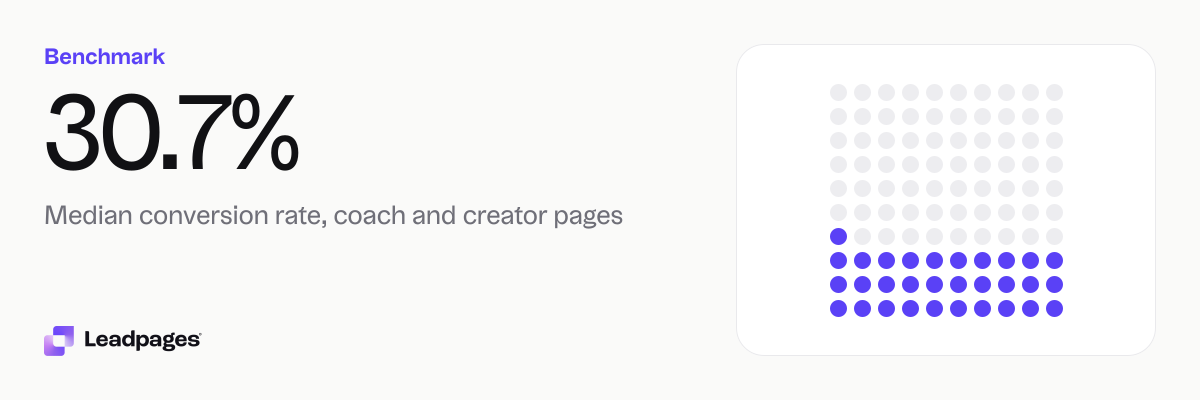
30.7%
Median conversion rate, coach and creator pages
19.8%
Median conversion rate, education pages
11.2%
Median conversion rate, healthcare pages
| Measure | Value |
|---|---|
| Median conversion rate, coach and creator pages | 30.7% |
| Median conversion rate, education pages | 19.8% |
| Median conversion rate, healthcare pages | 11.2% |
| Median conversion rate, finance pages | 14.9% |
| Median conversion rate, ecommerce pages | 6.84% |
| Median conversion rate, real estate pages | 9.65% |
| Median conversion rate, local service pages | 8.22% |
| Median conversion rate, squeeze and opt-in pages | 34.9% |
| Median conversion rate, webinar registration pages | 29.2% |
| Median conversion rate, landing pages | 15.6% |
| Median conversion rate, product pages | 9.25% |
| Median conversion rate, sales pages | 6.97% |
| Median conversion rate, all pages | 15.7% |
| Bottom quarter converts below, all pages | 4.66% |
| Top quarter converts above, all pages | 39% |
| Top tenth converts above, all pages | 62.4% |
| Share converting at 10% or better, all pages | 59.9% |
Median conversion rate, coach and creator pages
Median conversion rate, education pages
Median conversion rate, healthcare pages
Median conversion rate, finance pages
Median conversion rate, ecommerce pages
Median conversion rate, real estate pages
Median conversion rate, local service pages
Median conversion rate, squeeze and opt-in pages
Median conversion rate, webinar registration pages
Median conversion rate, landing pages
Median conversion rate, product pages
Median conversion rate, sales pages
Median conversion rate, all pages
Bottom quarter converts below, all pages
Top quarter converts above, all pages
Top tenth converts above, all pages
Share converting at 10% or better, all pages
Based on more than 13,000 published pages. As of November 16, 2026.
What a Solid Conversion Rate Actually Looks Like
“What’s a good number?” depends on context, but these anchors help you calibrate.
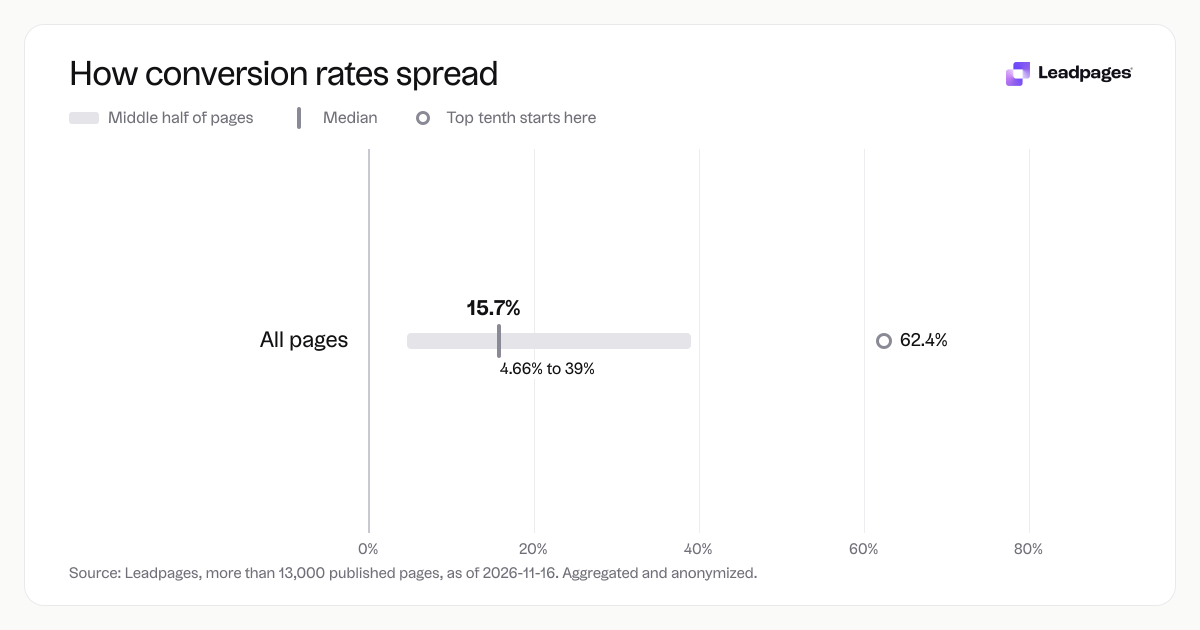
Across all industries and page types built with Leadpages, the median conversion rate is 15.7%. Half the pages converted under 15.7%, half over. It’s a useful starting point, not the whole picture.
The range is wide, and where you land depends on your offer and your visitors.
Conversion Rates by Industry and Page Type
Industry and page type heavily shape what you should expect.
By industry
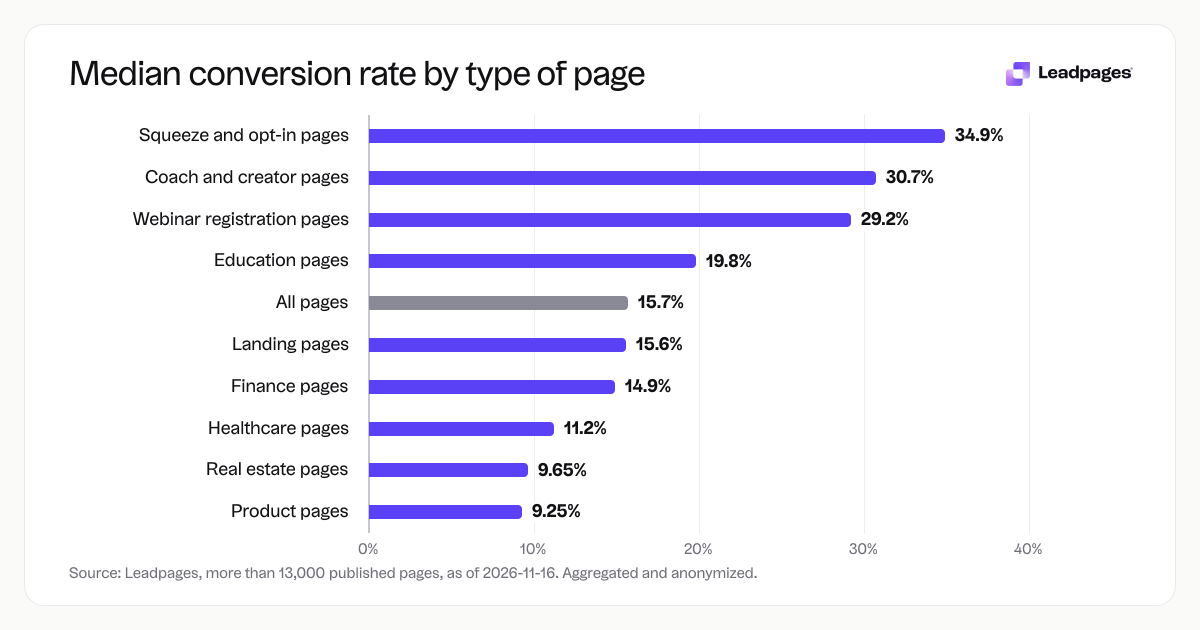
- Coach and creator pages: 30.7% median
- Education pages: 19.8% median
- Finance pages: 14.9% median
- Healthcare pages: 11.2% median
- Real estate pages: 9.65% median
- Local service pages: 8.22% median
- Ecommerce pages: 6.84% median
Offers built on a personal brand (coaching, consulting) tend to convert much higher than a product listing or local service inquiry. That doesn’t mean ecommerce pages are broken—it reflects visitor intent and the size of the commitment.
By page type
- Squeeze and opt‑in pages: 34.9% median
- Webinar registration pages: 29.2% median
- Landing pages: 15.6% median
- Product pages: 9.25% median
- Sales pages: 6.97% median
Low‑commitment asks (an email for a lead magnet, a free webinar registration) typically see higher rates. Full sales pages, where the visitor is expected to buy, have the lowest medians. Benchmark your page against the same type.
What the Top Performers Do Differently
They’re not secrets, but they’re easy to skip when you’re moving fast.
They answer one question for one audience with one action. No multiple CTAs, no secondary offers above the fold. The headline makes a specific promise, and the copy backs it with concrete benefits, not a feature list.
They’re fast. Slow pages lose visitors before the headline gets read. And they’re tested on purpose. Pages that reach the top don’t start there. Small, data‑driven changes—headline phrasing, button copy, form fields—compound. Use a free A/B test significance calculator to confirm you’re seeing real lift, not noise.
Copy is a lever you can test quickly. Run your headline through a headline analyzer to check clarity and emotional pull. Then test variations. Many top‑quarter pages get there through iterative headline and CTA tweaks.
How to Interpret Your Own Conversion Rate
Start by finding the median for your industry and page type above. Then review your last 30 days of data.
If you’re above the median, you’re in a good spot—but not done. The gap between “good” and “great” can be a few points that add up to real revenue. Test one element at a time and let the data drive the next move.
If you’re below the median—or below the bottom‑quarter mark of 4.66%—fix the fundamentals first. Check your page’s clarity with a landing page analyzer. It’s a free tool that scores your page on checklist items like speed, headline strength, form friction, and mobile readability. Its suggested fixes often move the needle fast, without a full redesign.
After the obvious gaps, review the ask. A sales page that expects a purchase from a cold visitor will struggle. That’s not just a conversion issue—it’s a mismatch of offer to traffic temperature. Warm the audience with a lower‑commitment opt‑in or content page first.
About the Data: How We Measured These Rates
The benchmarks here come from aggregated, anonymized data across more than 13,000 pages published with Leadpages as of November 16, 2026. No individual business or visitor is identifiable. The figures represent median conversion rates—the middle value in each group—which helps filter out outliers. “Conversion” means the visitor took the page’s primary action (for example, submitting a form, registering, or purchasing). Use these figures as a reference, not a guarantee. Your rate will vary with traffic source, offer match, and other factors.
When you’re ready to find quick wins, start with a free scan from the landing page analyzer. It points to the changes most likely to increase your conversion rate, based on the same patterns that separate the top tenth of pages from the rest.