
Landing page benchmarks
Product Page Conversion Rate: Benchmarks From Thousands of Pages
See real product page conversion rate benchmarks from over 13,000 pages. Median, top-quarter, and top-decile figures, plus what high-performing pages do differently.
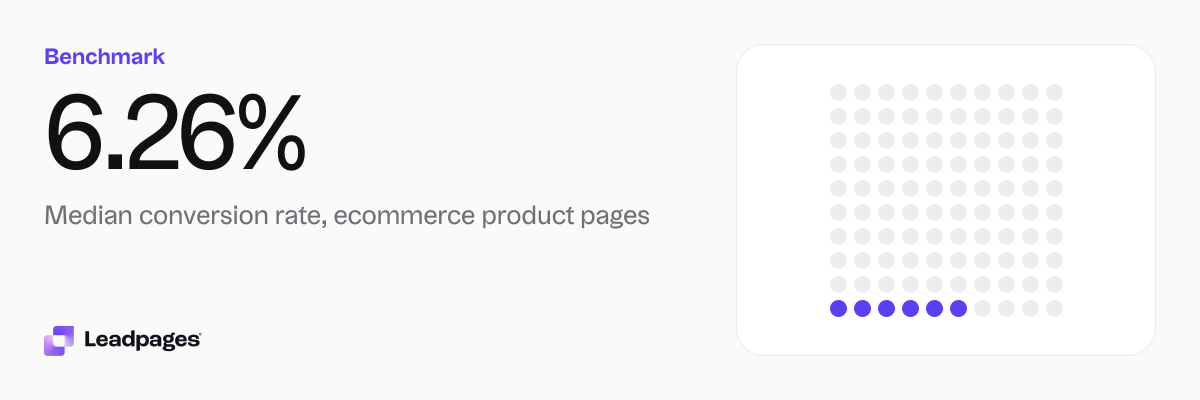
If you sell products online, you should know whether your product page conversion rate is healthy. Across ecommerce product pages published with Leadpages, the median conversion rate is 6.26%. Half convert below that mark, while the strongest pages go much higher — the top quarter surpass 24%, and the top tenth exceed 48.8%.
Leadpages data
Conversion rates for ecommerce product pages published with Leadpages, compared with all pages
more than 13,000 published pagesAs of November 17, 2026
6.26%
Median conversion rate, ecommerce product pages
2.53%
Bottom quarter converts below, ecommerce product pages
24%
Top quarter converts above, ecommerce product pages
| Measure | Value |
|---|---|
| Median conversion rate, ecommerce product pages | 6.26% |
| Bottom quarter converts below, ecommerce product pages | 2.53% |
| Top quarter converts above, ecommerce product pages | 24% |
| Top tenth converts above, ecommerce product pages | 48.8% |
| Share converting at 10% or better, ecommerce product pages | 38.2% |
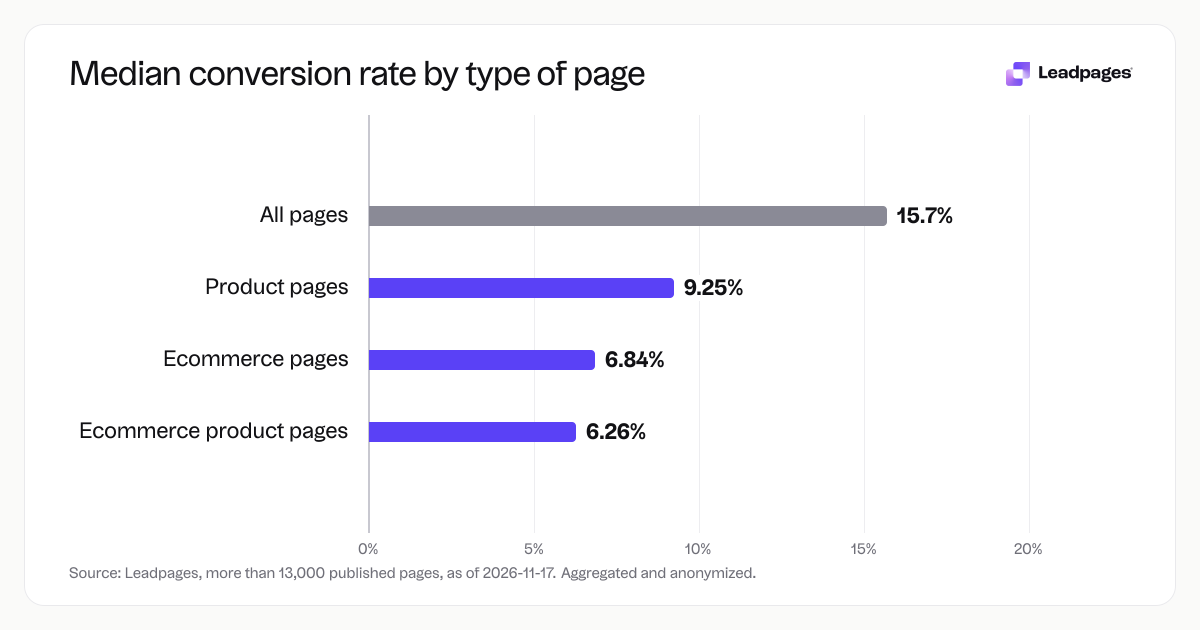
| Median conversion rate, ecommerce pages | 6.84% |
| Bottom quarter converts below, ecommerce pages | 2.88% |
| Top quarter converts above, ecommerce pages | 30.3% |
| Top tenth converts above, ecommerce pages | 63.4% |
| Share converting at 10% or better, ecommerce pages | 41.2% |
| Median conversion rate, product pages | 9.25% |
| Bottom quarter converts below, product pages | 3.18% |
| Top quarter converts above, product pages | 25.1% |
| Top tenth converts above, product pages | 51.9% |
| Share converting at 10% or better, product pages | 47.9% |
| Median conversion rate, all pages | 15.7% |
| Bottom quarter converts below, all pages | 4.66% |
| Top quarter converts above, all pages | 39% |
| Top tenth converts above, all pages | 62.4% |
| Share converting at 10% or better, all pages | 59.9% |
Median conversion rate, ecommerce product pages
Bottom quarter converts below, ecommerce product pages
Top quarter converts above, ecommerce product pages
Top tenth converts above, ecommerce product pages
Share converting at 10% or better, ecommerce product pages
Median conversion rate, ecommerce pages
Bottom quarter converts below, ecommerce pages
Top quarter converts above, ecommerce pages
Top tenth converts above, ecommerce pages
Share converting at 10% or better, ecommerce pages
Median conversion rate, product pages
Bottom quarter converts below, product pages
Top quarter converts above, product pages
Top tenth converts above, product pages
Share converting at 10% or better, product pages
Median conversion rate, all pages
Bottom quarter converts below, all pages
Top quarter converts above, all pages
Top tenth converts above, all pages
Share converting at 10% or better, all pages
Based on more than 13,000 published pages. As of November 17, 2026.
A quick look at ecommerce product page conversion rates
These numbers show how real product pages perform. They’re pulled from more than 13,000 pages, aggregated and anonymized.
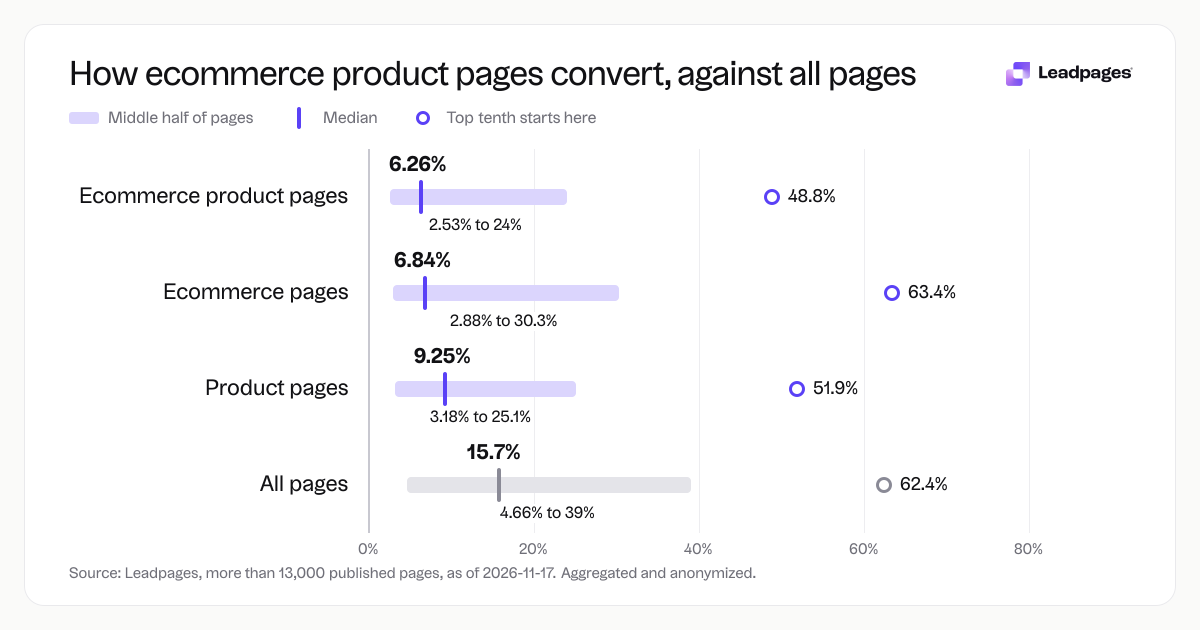
- Median conversion rate: 6.26%
- Bottom quarter converts below: 2.53%
- Top quarter converts above: 24%
- Top tenth converts above: 48.8%
Use these as a starting point, not a final verdict. Your traffic, product type, and price all shape your own result.
How conversion rates break down by performance tier
The spread shows a wide gap between average and top performers. The bottom quarter of ecommerce product pages convert fewer than 2.53% of visitors. The middle half falls between 2.53% and 24%, with the median at 6.26%. The upper quarter climbs beyond 24%, and the top tenth exceed 48.8%.
Double‑digit conversion is common enough that steady improvements can move a page from below median into higher tiers. You’ll see similar patterns in all-product-page benchmarks: the median for all product pages is 9.25%, while ecommerce‑specific pages face extra shopping friction that nudges the median lower. Whatever category you’re in, the takeaway is the same — small, consistent changes move you up the percentiles.
What the top quarter does differently
Product pages that convert above 24% tend to share a handful of practical traits. You don’t need to guess what works; apply these patterns step by step.
- A headline that makes the value clear in seconds. Use the free headline analyzer to test how direct and benefit‑focused your headline reads. The best ones tell a shopper exactly what they’ll get without clever wordplay.
- Visuals that show the product in use. Hero shots help; short demo videos or lifestyle images are better. Show scale, texture, and real‑world context.
- Social proof near the buy button. Customer reviews, star ratings, testimonials, and trust badges reduce hesitation. If you can, include a photo of a real customer using the product.
- One strong call‑to‑action. Don’t scatter multiple buttons. Pick the single next step — “Add to cart” or “Buy now” — and make it obvious. Read the CTA guide for placement and wording that convert.
- Minimal form fields. Ask only for what you need to complete the purchase. More fields lower completion rates.
- Mobile‑first design. Most visitors browse on a phone. A page that loads quickly, fits the screen, and lets shoppers scroll and tap without pinching wins. Browse the template gallery for product page layouts built for mobile speed.
- Clear shipping costs, returns, and guarantees. Show the total price upfront, state the return window, and mention any money‑back guarantee. That reduces the anxiety that blocks checkout.
Test one element at a time, not a flurry of changes. When you run a split test, use an A/B test calculator to know when the result is statistically significant. Otherwise you might chase random noise instead of real improvement. You can set up structured tests with the A/B testing tool in Leadpages.
How to read your own product page conversion rate
Benchmarks are reference points, not a report card. Your number depends on context, and the goal is steady improvement.
- Segment by traffic source. Email or direct traffic often converts higher than social or display ads. Check Leadpages analytics to see where your best visitors come from and how they behave on the page.
- Factor in price and product type. Compare your page to others with a similar price range and average order value.
- Look at the trend, not a single snapshot. A new product page may start lower while you learn what resonates. Track conversion rate week over week to see whether it’s climbing or stalling.
- Know where you stand relative to peers. If your rate sits below 2.53%, you’re in the bottom quarter. Between 2.53% and 6.26% puts you in the middle half. Above 6.26% means you’re above the median, and crossing 24% puts you in the top quarter. Each tier suggests a next step — fix the basics first, then layer on advanced tests.
Even small lifts matter. On 10,000 monthly visitors, modest gains can add hundreds of purchases without extra ad spend. That’s why strong marketers treat product page optimization as ongoing work, not a one‑time fix.
How we measured this
The data comes from more than 13,000 published pages. Aggregated and anonymized; as of 2026-11-17. We isolated ecommerce product pages — pages designed to sell a single product online. All figures are aggregated and anonymized; no individual page or business is identifiable.
We defined conversion rate as the share of unique visitors who completed the intended goal (a product purchase). Because the sample spans different industries, traffic volumes, and price points, the benchmarks reflect the noise and variety you see in everyday marketing — not lab conditions, just real pages doing real work.
Turn your benchmarks into improvements. Score your landing page for free.