
Landing page benchmarks
What’s a good sales page conversion rate?
What’s a good sales page conversion rate? See median and top-quarter figures from 13,000+ sales pages, plus practical tips to improve your results.
A sales page exists to close the deal, so its conversion rate is one of the key numbers in any campaign. The right benchmark shows whether a page is pulling its weight or wasting traffic. Below you’ll find real conversion data from sales pages published with Leadpages, what top performers do differently, and how to judge your own results.
Leadpages data
Conversion rates for sales pages published with Leadpages, compared with all pages
more than 13,000 published pagesAs of November 17, 2026
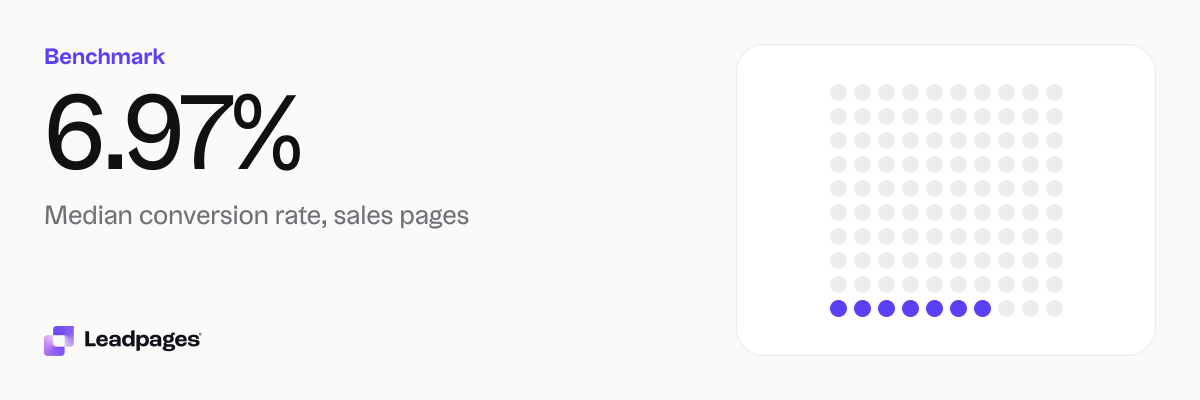
6.97%
Median conversion rate, sales pages
3.19%
Bottom quarter converts below, sales pages
13.8%
Top quarter converts above, sales pages
| Measure | Value |
|---|---|
| Median conversion rate, sales pages | 6.97% |
| Bottom quarter converts below, sales pages | 3.19% |
| Top quarter converts above, sales pages | 13.8% |
| Top tenth converts above, sales pages | 24.9% |
| Share converting at 10% or better, sales pages | 37.5% |
| Median conversion rate, all pages | 15.7% |
| Bottom quarter converts below, all pages | 4.66% |
| Top quarter converts above, all pages | 39% |
| Top tenth converts above, all pages | 62.4% |
| Share converting at 10% or better, all pages | 59.9% |
Median conversion rate, sales pages
Bottom quarter converts below, sales pages
Top quarter converts above, sales pages
Top tenth converts above, sales pages
Share converting at 10% or better, sales pages
Median conversion rate, all pages
Bottom quarter converts below, all pages
Top quarter converts above, all pages
Top tenth converts above, all pages
Share converting at 10% or better, all pages
Based on more than 13,000 published pages. As of November 17, 2026.
The short answer on sales page conversion rates
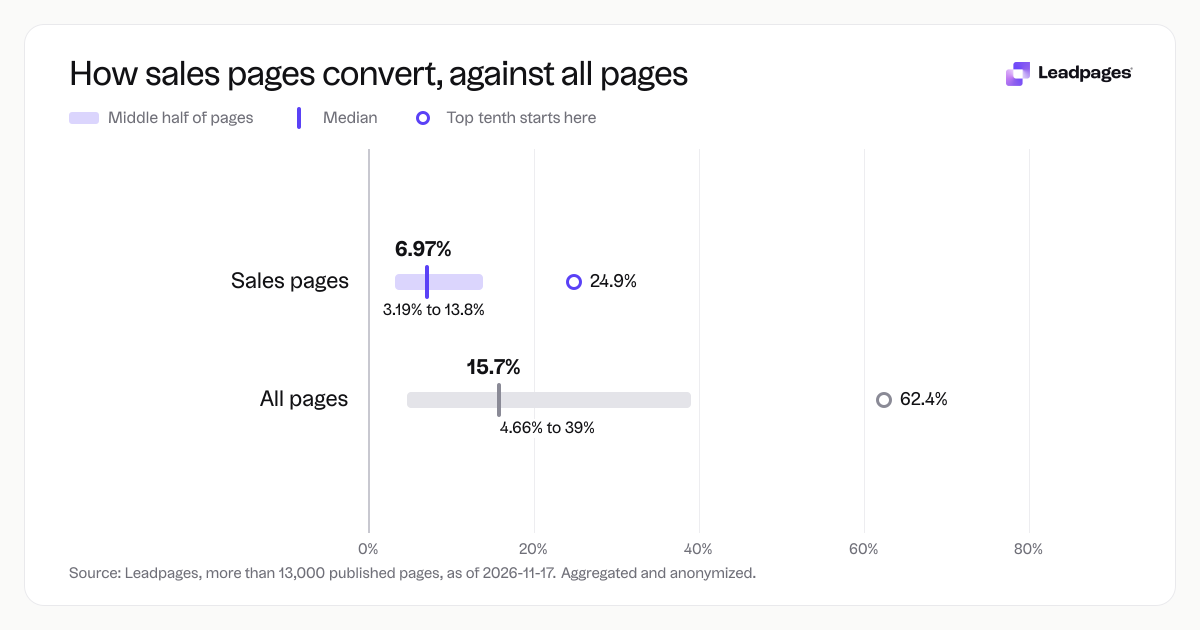
Across more than 13,000 sales pages published with Leadpages, the median conversion rate is 6.97%. Half of sales pages convert above that line and half below. If your page clears that mark, you’re already beating the typical page.
But the middle isn’t the whole story. The top quarter of sales pages in our data convert above 13.8%, and the top tenth surpass 24.9%. Many marketers reach rates several times higher than the median. The gap between the middle and the top is where most of the opportunity sits.
How the numbers break down
To give you a full picture, we looked at conversion rates for all landing pages published through Leadpages—not just sales pages—and compared the two groups.
| Group | Bottom quarter below | Median | Top quarter above | Top tenth above |
|---|---|---|---|---|
| Sales pages | 3.19% | 6.97% | 13.8% | 24.9% |
| All landing pages | 4.66% | 15.7% | 39% | 62.4% |
Two things stand out. First, sales pages convert more slowly than landing pages as a whole. A sales page usually asks for a purchase decision, while many other landing pages ask for lighter actions—an email address, a webinar sign-up, or a content download. The commitment is higher, so the rates are lower.
Second, the range within sales pages is wide. The bottom quarter of pages convert at less than 3.19%, while the top quarter sit above 13.8%. Hitting double digits isn’t an outlier—it’s a target many pages already reach.
Put these figures in context. A low-priced offer often converts at a higher rate than a high-ticket service. Traffic source changes results too: visitors from a warm email list behave differently than cold traffic from a paid social ad. Use these numbers as direction, not a pass-or-fail test.
What the top quarter does differently
Pages above the 13.8% threshold share a common approach. After studying the pages in our platform, we see a few patterns that separate them. None are secrets—just practical choices you can make now.
They match the promise to the traffic source. A visitor clicks an ad that says “14-day meal plan for runners” and lands on a page with that exact headline and offer. No bait-and-switch. No generic welcome. Message match is non-negotiable.
They tell a single story. A strong sales page doesn’t try to sell the product, the bonus, the guarantee, and the founder’s story at once. It picks one clear thread and pulls it through the headline, the body copy, and the call to action. That focus reduces friction and keeps visitors moving.
They design for scanning, not reading. Most visitors won’t read every word. The best sales pages use short paragraphs, bold sub-headings, and plenty of white space. A quick skim still shows what’s being sold and why it matters.
They remove unnecessary steps. Every extra click, field, or moment of confusion costs conversions. Top pages keep the path from top of page to completed purchase short and obvious. If a form asks for information that isn’t needed to finish the transaction, it gets cut.
They test often and small. You don’t need a full redesign to improve. Pages at the top got there through small, frequent experiments—a new headline, a different image, a button color, a shifted testimonial. They use A/B testing to let data, not opinions, decide.
They lean on social proof that feels real. A vague “trusted by thousands” doesn’t help. Top pages use specific testimonials with names, photos, and concrete results. Some add video testimonials so a real customer can do the selling.
They match the follow-through. The sale doesn’t end at the thank-you page. Top sellers send a clear confirmation email, deliver the product or access immediately, and set expectations for what happens next. That follow-through builds trust that turns into referrals and repeat purchases.
How to read your own number
Benchmarks help, but your own sales page conversion rate is the number that matters. Here’s how to read it well.
Start by segmenting your traffic. A blended conversion rate—all visitors from every source combined—can hide the real story. Separate results by traffic source, campaign, and device. You may find that warm audiences convert far better than cold paid traffic. That tells you exactly where to focus.
Compare rates over time, not only in a snapshot. A page that improves month over month is on the right track even if it’s below a published average. Look for trends rather than one-time scores.
Set your own baseline before comparing to industry figures. When you launch a sales page, measure it for 30 days and treat that as your starting line. Then beat it. Moving from a lower rate to a higher one on your own page is the win that counts.
Tie conversion rate back to revenue. Conversion rate is important, but it’s not the final score. A page with a lower rate and a higher average order value can earn more profit than a page with a higher rate and a low-priced product. Connect your rate to actual dollars earned.
If your rate seems low, check quick fixes first. Is the page slow on mobile? Is the headline clear to a first-time visitor? Are you asking for a phone number when an email address would be enough? Small friction points often explain a large share of the gap between your rate and the median.
How we measured this
Scope: Conversion rates for sales pages published with Leadpages, compared with all pages. Sample: more than 13,000 published pages. Aggregated and anonymized; as of 2026-11-17.
We calculated conversion rate as the number of visitors who completed the primary action on a page (a purchase, for sales pages) divided by the total number of unique visitors to that page during the measurement period. We then grouped those individual page-level rates and reported the median, bottom-quarter, top-quarter, and top-tenth thresholds you see above.
The “all landing pages” group includes every type of landing page on the platform: sales pages, lead capture pages, webinar registration pages, thank-you pages, and more. This comparison shows how the heavier commitment a sales page asks for affects its conversion figures relative to other page types.
Averages can be misleading for this kind of data because a small number of extremely high or extremely low pages can skew the picture. We report medians and percentiles because they describe what a typical page experiences, not what a few outliers distort.
Keep in mind that every sales page operates in its own context. Price point, audience temperature, traffic source, and product type all influence the conversion rate. These benchmarks give you a reasonable range, but your own data gets the final say.
Want a quick read on how your page stacks up now? Run your URL through our free landing page analyzer to get a practical score and actionable suggestions in under a minute.