
How-to guides
AB Testing: A Practical Guide for Better Conversions
A practical guide to A/B testing your landing pages. Learn step-by-step how to run tests, avoid common problems, and use data to improve conversion rates.
Leadpages data
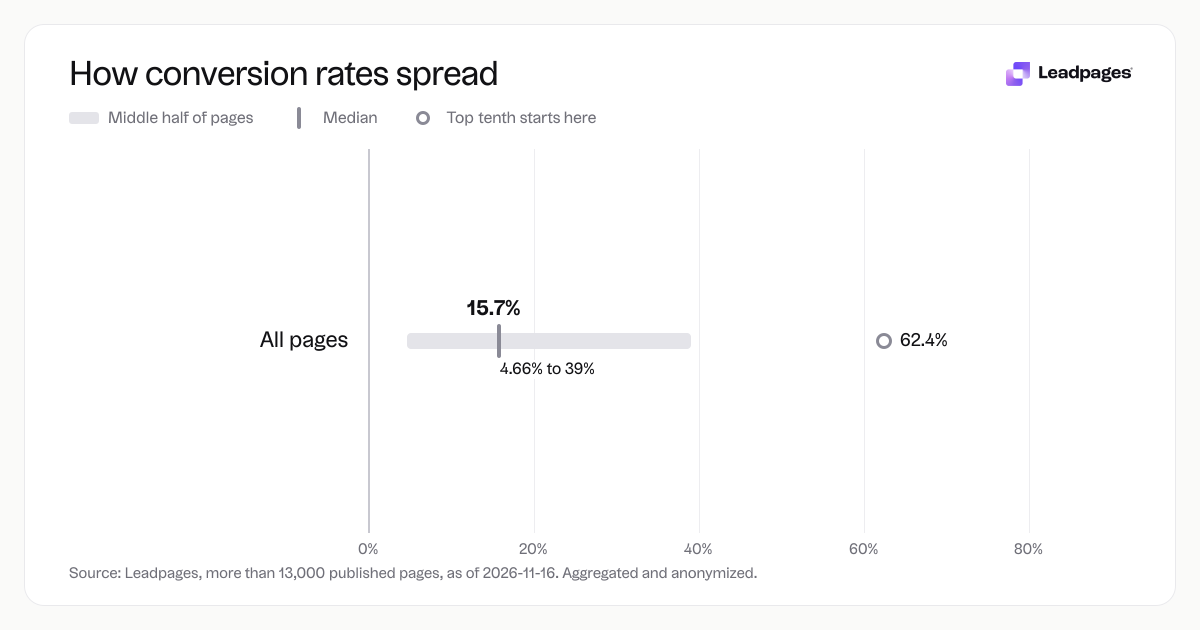
Conversion rates for pages published with Leadpages, by industry and page type
more than 13,000 published pagesAs of November 16, 2026
15.7%
Median conversion rate, all pages
4.66%
Bottom quarter converts below, all pages
39%
Top quarter converts above, all pages
| Measure | Value |
|---|---|
| Median conversion rate, all pages | 15.7% |
| Bottom quarter converts below, all pages | 4.66% |
| Top quarter converts above, all pages | 39% |
| Top tenth converts above, all pages | 62.4% |
| Share converting at 10% or better, all pages | 59.9% |
Median conversion rate, all pages
Bottom quarter converts below, all pages
Top quarter converts above, all pages
Top tenth converts above, all pages
Share converting at 10% or better, all pages
Based on more than 13,000 published pages. As of November 16, 2026.
A/B testing (also called split testing) compares two versions of a web page to see which one converts more visitors. You show version A to part of your audience and version B to the rest, then measure the difference. This guide walks you through the process, from picking what to test to reading the results—and shows what to do next.
A/B Testing at a Glance
Every landing page can improve. Across pages published with Leadpages, the median conversion rate is 15.7%. Yet the bottom quarter of pages converts below 4.66%, while the top quarter converts above 39%, and the top tenth above 62.4%. In fact, 59.9% of pages convert at a double-digit rate. Where your page lands depends on your choices—and A/B testing shows which choices actually lift that number.
The idea is simple: change one element (say, the headline), split traffic evenly between the original and the variant, and wait until the data shows which one performs better. You’re not guessing. Your visitors decide.
You can test almost anything on a landing page: the headline, call-to-action button text or color, the hero image, form length, the offer, layout, even the background color. The key is to test one change at a time so you know exactly what caused the result.
How to Run an A/B Test Step by Step
Testing sounds technical, but you can run your first test quickly. Follow these steps.
1. Choose one item to test
Start with the element most likely to move your primary conversion metric—usually the headline or the call-to-action. Pick something you can change without breaking the page.
2. Write a clear hypothesis
A hypothesis keeps you honest. Instead of “I’ll try a different headline,” write: “Changing the headline from ‘Get Started’ to ‘Start Your Free Trial’ will increase sign-ups because it makes the offer more concrete.” You’ll compare the result against this statement.
3. Create the variant
Build a second version of your page with that single change. If you use a landing page builder, you can duplicate your page and edit the element. In Leadpages, the A/B testing feature lets you create a variant from the page editor and run both versions at the same time.
4. Split your traffic
Send half your visitors to version A and half to version B. The platform should randomize the split automatically. Do not send different sources to different versions—that contaminates the test.
5. Let the test run until you can rely on the result
Don’t stop the minute one version pulls ahead. You need enough visits and conversions to be sure. Use a free A/B test significance calculator to check when your result is statistically reliable. Call a winner only when the data is stable.
6. Analyze, then act
If the variant wins, make it the new default. If the original wins, that’s fine—you learned something. Either way, document the outcome and use it to inform your next test. Don’t declare a tie because the gap looks small; trust the numbers.
Common A/B Testing Problems and How to Avoid Them
Testing is straightforward, but a few mistakes trip people up. Watch for these.
Testing too many changes at once
If you alter the headline, image, and button color in one variant, you can’t tell which change drove the result. Limit yourself to one variable per test. If you must test multiple elements, run a multivariate test—but that requires far more traffic.
Stopping the test too early
You see a spike and call it. That’s a recipe for false winners. Small samples cause misleading swings. Wait until your A/B test calculator shows a meaningful result. Most tests need at least one to two weeks to cover weekday patterns.
Running a test on a page with too little traffic
If your page gets only a handful of visitors a day, it could take months to reach significance. Test pages with steady traffic first. Or drive more traffic—through ads or email—to shorten the wait.
Ignoring statistical significance entirely
A small lift with 50 visitors is often noise. A modest lift with 5,000 visitors might be a real advantage. Always verify the result with a tool like the A/B test significance calculator. Don’t trust “gut feel” alone.
Tweaking things that don’t matter
A slightly different shade of blue on the button rarely transforms conversion rates. Test elements that directly affect decisions: the offer, value proposition, social proof, and the main call-to-action. Small wins add up, but start with changes that can genuinely shift behavior.
Not testing at all
The biggest mistake is launching a page and leaving it alone. Even a strong page can get better. Run one test, learn from it, then run another.
What to Do After Your First A/B Test
Your first test is just the start. Here’s how to build on it.
First, implement the winning version. Then look at the page with fresh eyes. What’s the next weak spot? The form? Supporting copy? Trust signals? Pick a new hypothesis and create another variant.
Not sure where to focus? Run your page through a free landing page analyzer to get a score and spot improvement areas. If your headline never felt quite right, try the free headline analyzer to generate and score alternatives. For button or link text, the call-to-action generator gives you ideas in seconds.
When you’re ready to test a bigger change—a completely different layout or a new offer—browse high-converting landing page templates. Start from a proven design, then A/B test your way up.
Most importantly, make testing a habit. One test a month compounds into a conversion rate that beats the middle of the pack. Across pages published with Leadpages, the median conversion rate is 15.7%—but the top quarter converts above 39%. The difference is steady testing and optimization.
Start building free and run your first A/B test on a live page this week.
How we measured conversion rates
The figures in this guide come from an anonymized, aggregated sample of more than 13,000 pages published with Leadpages, as of 2026-11-16. The sample spans multiple industries and page types. We reported the median conversion rate (15.7%), the bottom-quarter threshold (4.66%), the top-quarter threshold (39%), the top-tenth threshold (62.4%), and the share of pages converting at a double-digit rate (59.9%). No individual customer data was used.