
Landing page benchmarks
Mobile vs Desktop Conversion Rate: Benchmarks from 5,700+ Pages
See actual mobile vs desktop conversion rate data from 5,700+ Leadpages landing pages. Get median, quartile, and load speed insights to benchmark your performance.
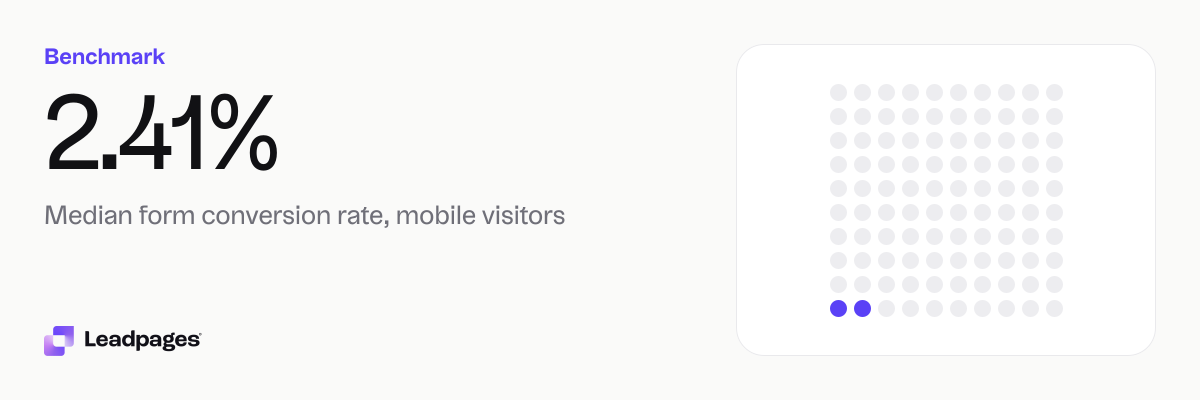
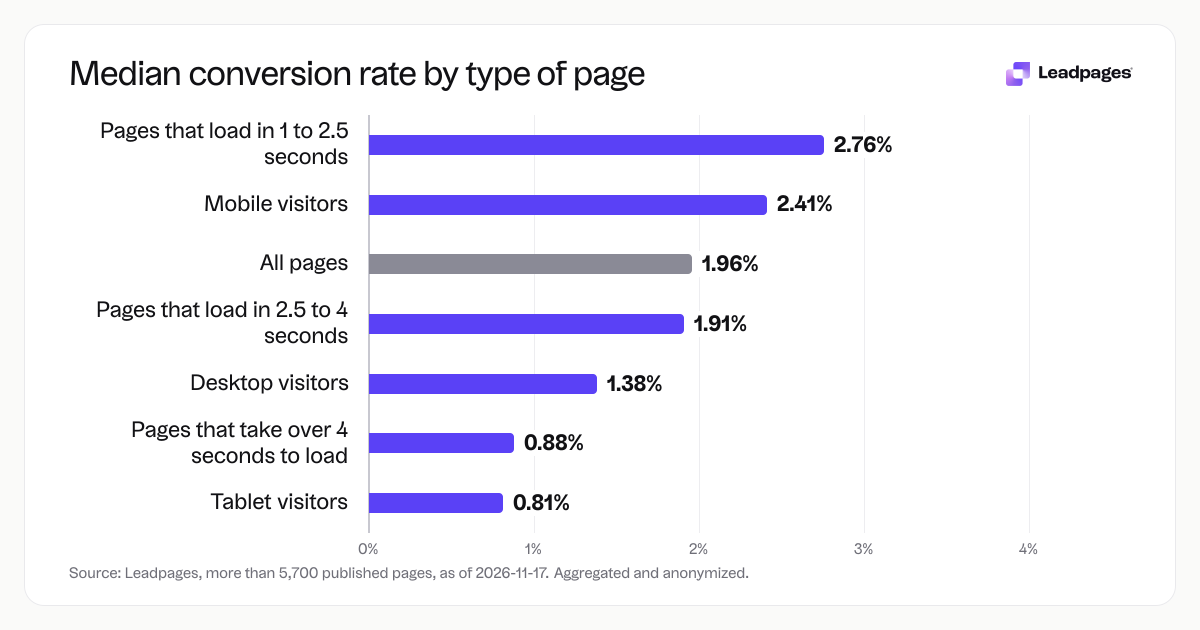
Mobile landing pages convert better than desktop pages, on average. Across pages published with Leadpages, the median form conversion rate on mobile was 2.41%, compared with 1.38% on desktop. Tablet came in at a median of 0.81%, and load speed clearly influenced results.
Leadpages data
Form conversion rates for pages published with Leadpages, by device, over the 90 days to 2026-11-16. A form conversion rate is the share of visits to a page in which the visitor submitted its form. Each figure is a median or quartile across pages. It describes the pages in a group, not what causes the difference between groups.
more than 5,700 published pagesAs of November 17, 2026
2.41%
Median form conversion rate, mobile visitors
0.1%
Bottom quarter converts below, mobile visitors
16%
Top quarter converts above, mobile visitors
| Measure | Value |
|---|---|
| Median form conversion rate, mobile visitors | 2.41% |
| Bottom quarter converts below, mobile visitors | 0.1% |
| Top quarter converts above, mobile visitors | 16% |
| Top tenth converts above, mobile visitors | 42.8% |
| Median form conversion rate, desktop visitors | 1.38% |
| Bottom quarter converts below, desktop visitors | 0% |
| Top quarter converts above, desktop visitors | 7.02% |
| Top tenth converts above, desktop visitors | 26.5% |
| Median form conversion rate, tablet visitors | 0.81% |
| Bottom quarter converts below, tablet visitors | 0% |
| Top quarter converts above, tablet visitors | 7.64% |
| Top tenth converts above, tablet visitors | 33.2% |
| Median form conversion rate, pages that load in 1 to 2.5 seconds | 2.76% |
| Median form conversion rate, pages that load in 2.5 to 4 seconds | 1.91% |
| Median form conversion rate, pages that take over 4 seconds to load | 0.88% |
| Median form conversion rate, all pages | 1.96% |
Median form conversion rate, mobile visitors
Bottom quarter converts below, mobile visitors
Top quarter converts above, mobile visitors
Top tenth converts above, mobile visitors
Median form conversion rate, desktop visitors
Bottom quarter converts below, desktop visitors
Top quarter converts above, desktop visitors
Top tenth converts above, desktop visitors
Median form conversion rate, tablet visitors
Bottom quarter converts below, tablet visitors
Top quarter converts above, tablet visitors
Top tenth converts above, tablet visitors
Median form conversion rate, pages that load in 1 to 2.5 seconds
Median form conversion rate, pages that load in 2.5 to 4 seconds
Median form conversion rate, pages that take over 4 seconds to load
Median form conversion rate, all pages
Based on more than 5,700 published pages. As of November 17, 2026.
The Short Answer: Mobile Converts Higher
Across more than 5,700 published pages, mobile visitors submitted forms more often than desktop visitors. The median form conversion rate on mobile was 2.41%. On desktop, the median was 1.38%.
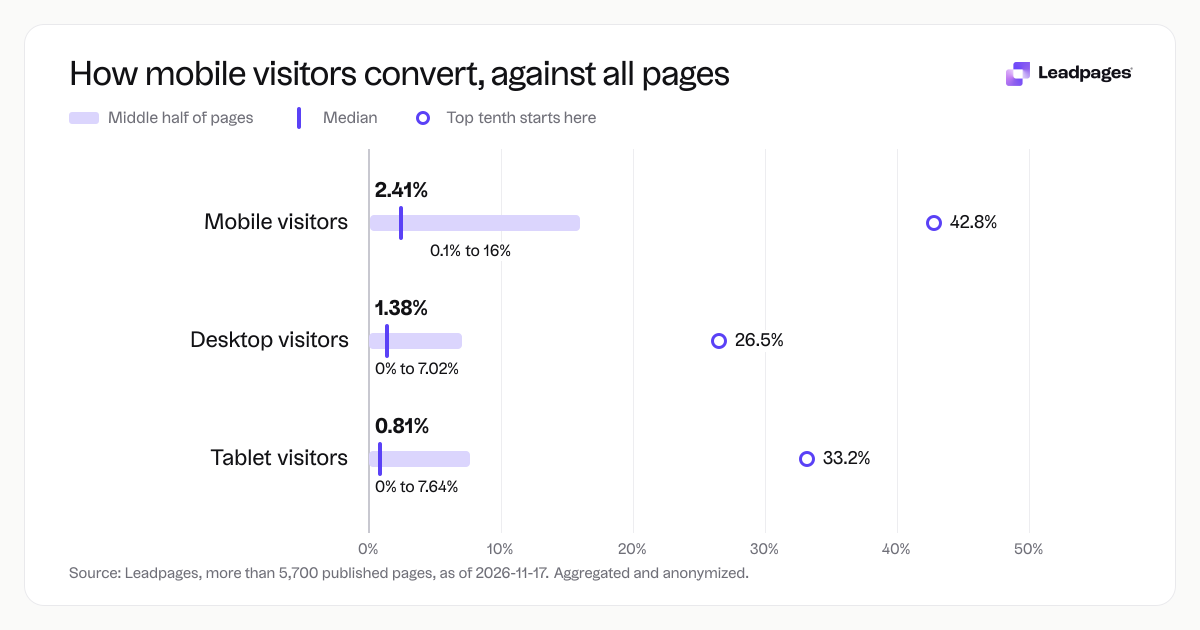
But medians only show the middle. The spread between top and bottom performers is wide, especially on mobile, where the top quarter of pages converts above 16%. Seeing that full range—and where your numbers land—helps you decide where to invest: mobile, desktop, or both.
How the Numbers Break Down: Medians, Quartiles, and Speed
The data below covers form conversion rates for pages published with Leadpages, measured by device, over the 90 days ending November 16, 2026. A form conversion rate is the share of visits to a page in which the visitor submitted its form. Every figure is a median or quartile across pages. It describes groups of pages, not what causes differences between devices.
Device breakdown
- Mobile median: 2.41%
Bottom quarter converts below: 0.1%
Top quarter converts above: 16%
Top tenth converts above: 42.8% - Desktop median: 1.38%
Bottom quarter converts below: 0%
Top quarter converts above: 7.02%
Top tenth converts above: 26.5% - Tablet median: 0.81%
Bottom quarter converts below: 0%
Top quarter converts above: 7.64%
Top tenth converts above: 33.2%
Across all devices, the overall median form conversion rate was 1.96%.
Load speed and conversion We also looked at form conversion rates by load-time bracket, across all devices. Faster pages showed higher median conversion rates:
- Pages that load in 1 to 2.5 seconds: median 2.76%
- Pages that load in 2.5 to 4 seconds: median 1.91%
- Pages that take over 4 seconds to load: median 0.88%
The difference between the slowest and fastest groups is a strong signal that speed matters. Quick-loading pages give visitors less time to leave before they see and use the form.
What the Top Quarter Does Differently
The top quarter of mobile pages converts above 16%. On desktop, the top quarter converts above 7.02%. These pages aren’t just slightly better—they pull well ahead of the median. The dataset doesn’t show exact causes, but a few patterns are common.
Start with load speed. The median conversion rate for pages that load in 1 to 2.5 seconds was 2.76%, which is above the overall median of 1.96%. Top-performing pages are often the ones a visitor can see and read almost instantly. That matters on mobile, where connections can be slower and patience is short.
Form simplicity also shows up in the top quartile. Pages that ask for fewer fields—often just an email—reduce friction that hurts mobile conversions. Pair that with a clear headline and a single call-to-action to limit distraction. You can build that kind of page with the Leadpages landing page builder and use lead capture forms that are easy to complete on a small screen.
A/B testing is another habit. Top performers are rarely first drafts. They come from testing headlines, form placement, and CTA copy. Use A/B testing in Leadpages to try variations and let the data show which version converts better on each device.
Finally, top-quarter pages align their message with the traffic source. If visitors arrive from a paid social ad, the page mirrors the language and visuals from the ad. There’s no disconnect. That consistency—often on mobile—can reflect in stronger conversion numbers.
How to Read Your Own Mobile vs Desktop Conversion Rate
Start by checking your current form conversion rates by device. If you publish with Leadpages, Leadpages analytics shows mobile, desktop, and tablet conversion side by side. Without a benchmark, it’s hard to tell if your mobile rate is strong or if you’re leaving leads on the table.
Use the benchmarks above as a quick guide:
- If your mobile rate is above 2.41%, you’re already above the median. You’re ahead of half the pages we analyzed.
- If your mobile rate is above 16%, you’re in the top quarter. That’s where pages start producing steady, reliable conversions.
- If your mobile rate is below 0.1%, you’re in the bottom quarter. Focus first on speed, form length, and your headline.
- On desktop, a rate above 1.38% puts you above the median. The top quarter starts at 7.02%.
- Faster pages tend to convert better. If your page takes over 4 seconds to load, aim to get it under 2.5 seconds. Even a modest speed gain can move you closer to the 2.76% median we saw for quick-loading pages.
Use a free tool to spot issues fast. The landing page analyzer scores your page and flags problems that may hold back mobile and desktop conversions. If you’re running split tests, the A/B test significance calculator shows when a winner is clear, so you don’t guess.
How We Measured This
The figures come from form conversion rates for pages published with Leadpages, measured by device, over the 90 days ending November 16, 2026. A form conversion rate is the share of visits to a page in which the visitor submitted its form.
We analyzed more than 5,700 published pages, aggregated and anonymized as of November 17, 2026. Every percentage you see is a median or quartile across pages. It describes the pages in a group, not what causes the difference between groups. For example, we can say that pages loading in 1 to 2.5 seconds had a median conversion rate of 2.76%, but that does not prove that speed alone caused that rate; it simply shows how those pages performed as a group.
The sample includes pages built for lead generation, webinar registration, ecommerce, SaaS, and more. The data is not segmented by industry or audience, so treat these numbers as a broad benchmark rather than a precise comparison for your niche.