
Landing page benchmarks
Above the Fold Conversion Rate: What 5,700+ Landing Pages Teach Us
Median above-the-fold conversion rate from 5,700+ Leadpages pages: 2.46% with above-fold CTA vs 1.37% below. Top quarter exceeds 15.1%. See full benchmarks.
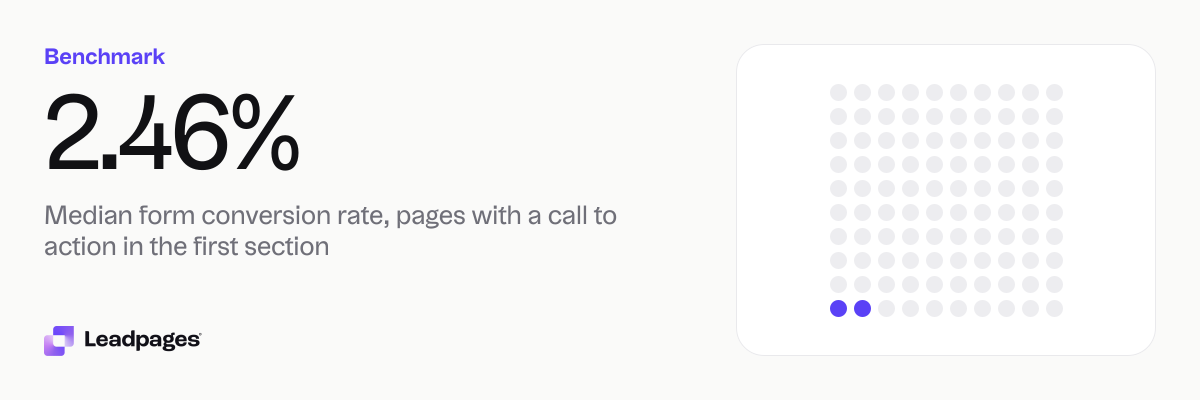
Across more than 5,700 landing pages built with Leadpages, the median form conversion rate for pages with a call to action in the first visible section is 2.46%. When the first CTA appears lower on the page, the median rate falls to 1.37%. In short: placing your offer above the fold correlates with a higher rate.
Leadpages data
Form conversion rates for pages published with Leadpages, by where the first call to action sits, over the 90 days to 2026-11-16. A form conversion rate is the share of visits to a page in which the visitor submitted its form. Each figure is a median or quartile across pages. It describes the pages in a group, not what causes the difference between groups.
more than 5,700 published pagesAs of November 17, 2026
2.46%
Median form conversion rate, pages with a call to action in the first section
0.35%
Bottom quarter converts below, pages with a call to action in the first section
15.1%
Top quarter converts above, pages with a call to action in the first section
| Measure | Value |
|---|---|
| Median form conversion rate, pages with a call to action in the first section | 2.46% |
| Bottom quarter converts below, pages with a call to action in the first section | 0.35% |
| Top quarter converts above, pages with a call to action in the first section | 15.1% |
| Top tenth converts above, pages with a call to action in the first section | 38.7% |
| Median form conversion rate, pages whose first call to action is further down | 1.37% |
| Bottom quarter converts below, pages whose first call to action is further down | 0.07% |
| Top quarter converts above, pages whose first call to action is further down | 7.09% |
| Top tenth converts above, pages whose first call to action is further down | 23.4% |
| Median form conversion rate, pages with the form in the first section | 9.46% |
| Median form conversion rate, pages with the form further down | 1.6% |
| Median form conversion rate, all pages | 1.96% |
Median form conversion rate, pages with a call to action in the first section
Bottom quarter converts below, pages with a call to action in the first section
Top quarter converts above, pages with a call to action in the first section
Top tenth converts above, pages with a call to action in the first section
Median form conversion rate, pages whose first call to action is further down
Bottom quarter converts below, pages whose first call to action is further down
Top quarter converts above, pages whose first call to action is further down
Top tenth converts above, pages whose first call to action is further down
Median form conversion rate, pages with the form in the first section
Median form conversion rate, pages with the form further down
Median form conversion rate, all pages
Based on more than 5,700 published pages. As of November 17, 2026.
The short answer
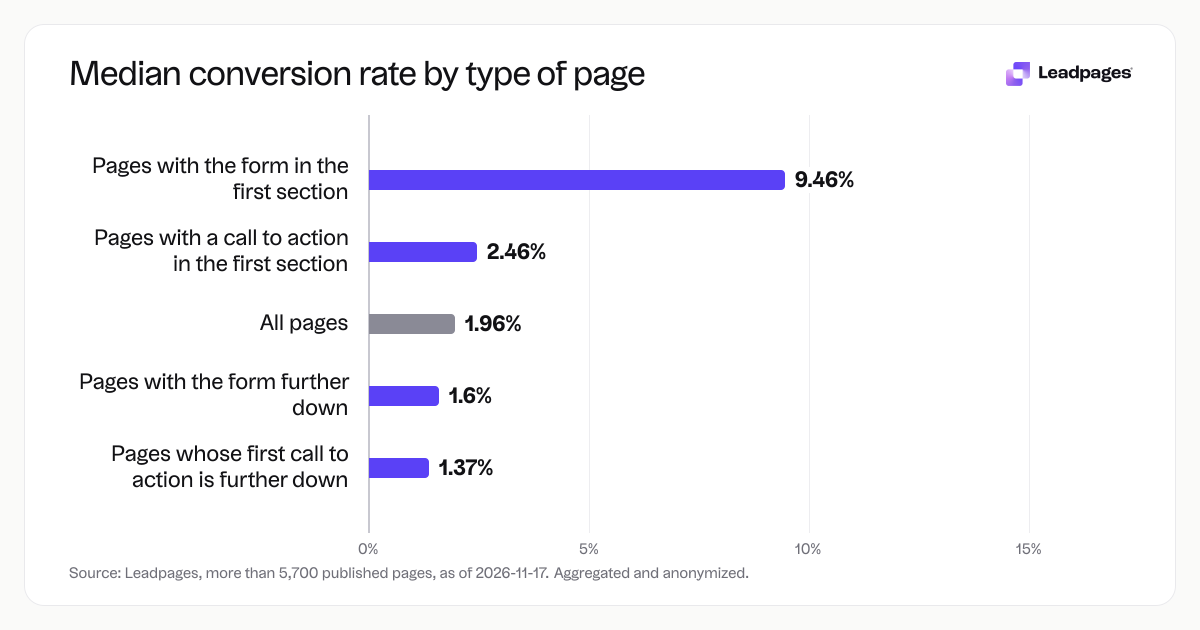
What’s a typical above the fold conversion rate? In our dataset, pages that show a CTA above the fold convert at a median of 2.46%, while pages whose first CTA sits further down see a median of 1.37%. The gap is consistent. For context, the overall median across all 5,700+ pages is 1.96%.
So if your page’s first call to action lives in that first screenful, a conversion rate around 2.46% puts you near the middle of the pack. But that’s only half the story. The range between the bottom and top performers is wide, and the real insight comes when you break the numbers apart.
How the numbers break down
The median only shows the midpoint. The spread shows what strong pages achieve, and where weak ones stall.
For pages with a CTA in the first section (above the fold):
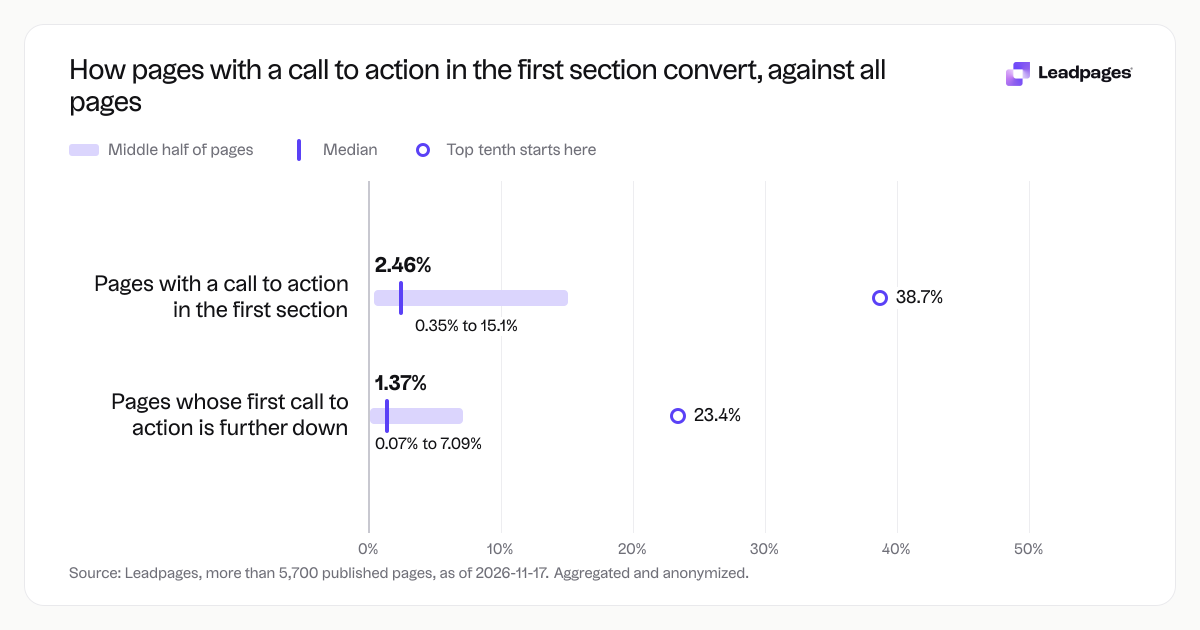
- Bottom quarter converts below 0.35%.
- Top quarter converts above 15.1%.
- Top tenth converts above 38.7%.
That means one in four pages with an above-fold CTA turns at least 15.1% of visits into form submissions. The very best pages top 38.7%.
When the first CTA lives further down the page, the entire distribution shifts:
- Bottom quarter converts below 0.07%.
- Top quarter converts above 7.09%.
- Top tenth converts above 23.4%.
Even the top tenth of pages with a below-fold CTA rarely reach the same level as strong above-fold pages. And the bottom quarter of those pages sees nearly no conversions—0.07% is a very low rate.
The location of the form itself matters even more. Pages that place the actual form fields in the first section have a median conversion rate of 9.46%. When the form sits lower on the page, the median drops to 1.6%. Letting visitors act without scrolling—right where the offer lands—raises the median sharply.
What the top quarter does differently
Pages that land in the top quarter (above 15.1% for above-fold CTAs, or above 7.09% for below-fold) share a handful of practical patterns. None rely on luck.
The headline tells the visitor exactly what they’ll get. It answers “what is this?” and “why should I care?” in one line. If your headline hedges or buries the value, people move on. Use a free headline analyzer to test yours against the elements that drive clarity and curiosity.
These pages also stick to a single call to action. One ask, one button, one outcome. When a page offers a demo, a download, and a newsletter signup in the same view, attention scatters and conversion drops.
Form length is another lever. Top-quartile pages ask only for what they need. A name and email address is often enough to start a conversation. Extra fields—phone number, company size, title—can pull your rate down, especially when they appear above the fold.
And they test. Teams that keep improving run small, frequent experiments. Swapping a button label or changing the hero image can nudge a page from the median into the top quarter. With an A/B test calculator, you can see whether a change is a real win or noise.
The pattern holds for pages that don’t put the first CTA above the fold. The stronger ones use a video or a sharp benefit statement to pull visitors down, and they add a clear CTA the moment the value is clear. But the math still favors getting the offer into the first section.
How to read your own number
These benchmarks are a starting point, not a scoreboard. Use them to place your page among similar pages, then dig into why.
If your page has an above-fold CTA and your conversion rate is below 2.46%, there’s room to move. Check three things. First, does your headline promise a clear, specific benefit? Second, are you asking for more information than you need right now? Third, is there a second action on the page that pulls attention from your primary CTA? Any one of those can hold you back.
If your conversion rate falls between 2.46% and 15.1%, you’re in the middle half of pages. The gap between you and the top quarter is often about steady testing—refining copy, trimming form fields, and tightening the offer until the numbers climb.
If you’re above 15.1%, you’re in the top quarter. That’s strong. But a rate that looks good against the benchmark can still leave leads on the table if your traffic is highly targeted. The top tenth pages show that 38.7% is possible with the right combination.
Traffic source matters. Organic search, paid ads, email, and social behave differently. A number that’s healthy for cold traffic can be weak for a warm list. Match your benchmarks to the context.
The quickest way to see where you stand is to run a diagnostic. Our landing page analyzer gives your page a score and shows which elements may be dragging down your above-the-fold conversion. It’s free and takes less than a minute.
How we measured this
We analyzed the form conversion rates of more than 5,700 landing pages published with Leadpages. The data covers the 90-day period ending on November 16, 2026, and was aggregated and anonymized as of November 17, 2026.
A page’s form conversion rate is the percentage of visits in which a visitor submitted that page’s form. We grouped pages by where the first call to action appeared: in the first visible section (above the fold) or further down. For a smaller subset, we also grouped pages by whether the form itself sat in the first section or not.
The figures we report are medians and quartile thresholds across pages, not averages of all visits. That means the 2.46% median for above-fold pages tells you the midpoint page—half of pages convert above that number and half convert below. The “top quarter above 15.1%” means a quarter of pages in that group had a conversion rate higher than 15.1%. The “top tenth above 38.7%” is the threshold for the highest tenth of pages.
No individual page, business, or visitor data was used. The patterns describe what happens across a large group, not what causes any single page to convert at a particular rate. But when the gap between above-fold and below-fold pages holds across medians, quartiles, and top-tenth thresholds, the signal is clear enough to act on.