
Landing page benchmarks
Email Marketing Conversion Rate: What the Data Shows
See what a good email marketing conversion rate looks like by page type. Based on data from more than 13,000 pages built with Leadpages.
When you send an email campaign, the landing page you link to does most of the conversion work. Across pages built with Leadpages, median conversion rates for page types often used in email marketing range from 15.6% for general landing pages to 34.9% for simple opt-in forms.
Leadpages data
Conversion rates for pages published with Leadpages, by industry and page type
more than 13,000 published pagesAs of November 19, 2026
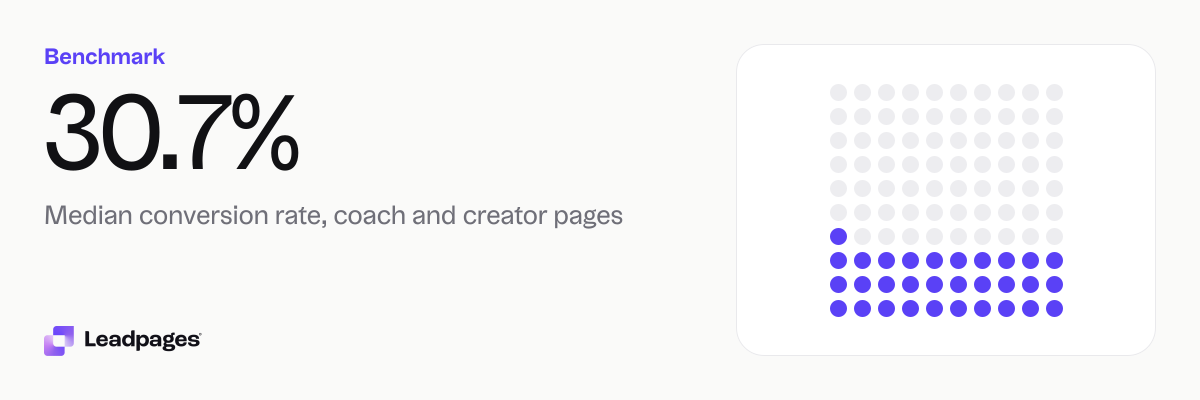
30.7%
Median conversion rate, coach and creator pages
19.8%
Median conversion rate, education pages
11.2%
Median conversion rate, healthcare pages
| Measure | Value |
|---|---|
| Median conversion rate, coach and creator pages | 30.7% |
| Median conversion rate, education pages | 19.8% |
| Median conversion rate, healthcare pages | 11.2% |
| Median conversion rate, finance pages | 14.9% |
| Median conversion rate, ecommerce pages | 6.84% |
| Median conversion rate, real estate pages | 9.65% |
| Median conversion rate, local service pages | 8.22% |
| Median conversion rate, squeeze and opt-in pages | 34.9% |
| Median conversion rate, webinar registration pages | 29.2% |
| Median conversion rate, landing pages | 15.6% |
| Median conversion rate, product pages | 9.25% |
| Median conversion rate, sales pages | 6.97% |
| Median conversion rate, all pages | 15.7% |
| Bottom quarter converts below, all pages | 4.66% |
| Top quarter converts above, all pages | 39% |
| Top tenth converts above, all pages | 62.4% |
| Share converting at 10% or better, all pages | 59.9% |
Median conversion rate, coach and creator pages
Median conversion rate, education pages
Median conversion rate, healthcare pages
Median conversion rate, finance pages
Median conversion rate, ecommerce pages
Median conversion rate, real estate pages
Median conversion rate, local service pages
Median conversion rate, squeeze and opt-in pages
Median conversion rate, webinar registration pages
Median conversion rate, landing pages
Median conversion rate, product pages
Median conversion rate, sales pages
Median conversion rate, all pages
Bottom quarter converts below, all pages
Top quarter converts above, all pages
Top tenth converts above, all pages
Share converting at 10% or better, all pages
Based on more than 13,000 published pages. As of November 19, 2026.
What’s a good email marketing conversion rate?
A “good” rate depends on the page you’re sending traffic to. Our data shows clear differences by page type:
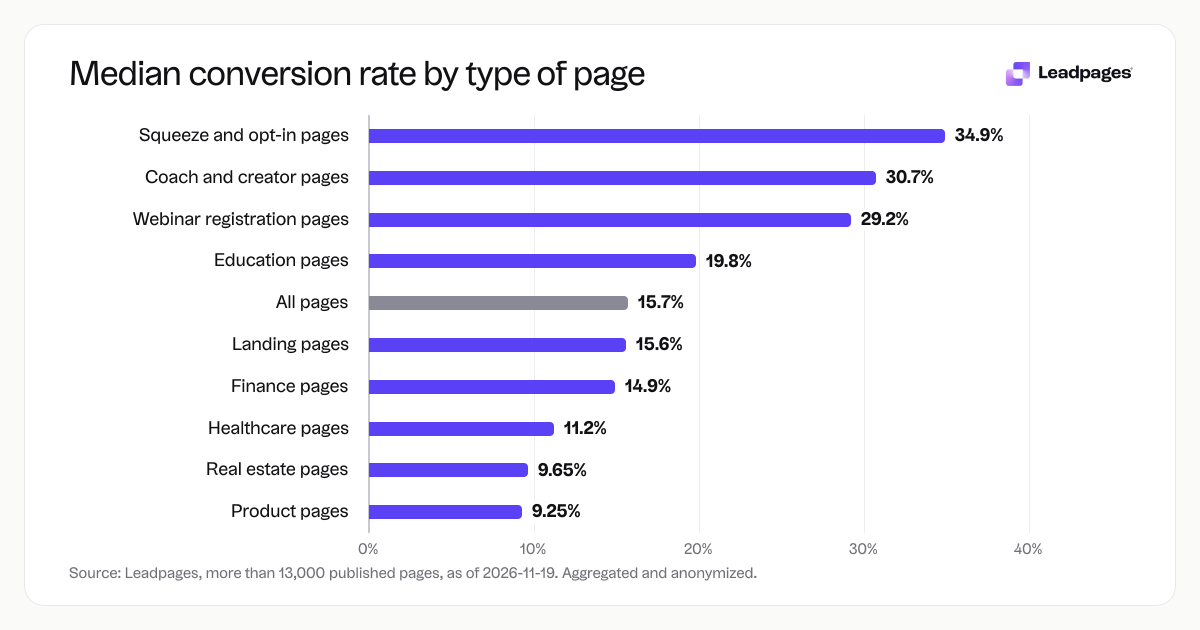
- Squeeze and opt-in pages — the kind you use to collect an email address with a single field — have a median conversion rate of 34.9%.
- Webinar registration pages, which ask for a little more information, convert at a median of 29.2%.
- Standard landing pages that explain an offer or capture leads have a median conversion rate of 15.6%.
If you’re emailing a list to a quick signup page, aim to beat the 34.9% median for squeeze pages. For a more detailed landing page, 15.6% is your baseline. Keep in mind these are medians — half of all pages do better, half do worse.
How different page types convert
Email clicks can land on almost any kind of page. Page type strongly influences how many visitors take the action you want. Here’s the median conversion rate for pages that commonly appear in email campaigns:
- Squeeze and opt-in pages: 34.9%
- Webinar registration pages: 29.2%
- Landing pages: 15.6%
- Product pages: 9.25%
- Sales pages: 6.97%
Product and sales pages convert lower because they ask for a purchase or a deeper commitment. Across all page types published with Leadpages, the overall median conversion rate is 15.7%.
Your industry also moves the number. If your email subscribers are in a specific sector, these benchmarks add context:
- Coach and creator pages: 30.7%
- Education pages: 19.8%
- Finance pages: 14.9%
- Healthcare pages: 11.2%
- Real estate pages: 9.65%
- Local service pages: 8.22%
- Ecommerce pages: 6.84%
A health coach emailing to an opt-in page might compare the squeeze page median of 34.9% and the coach-creator industry median of 30.7% to set expectations.
How the top performers get ahead
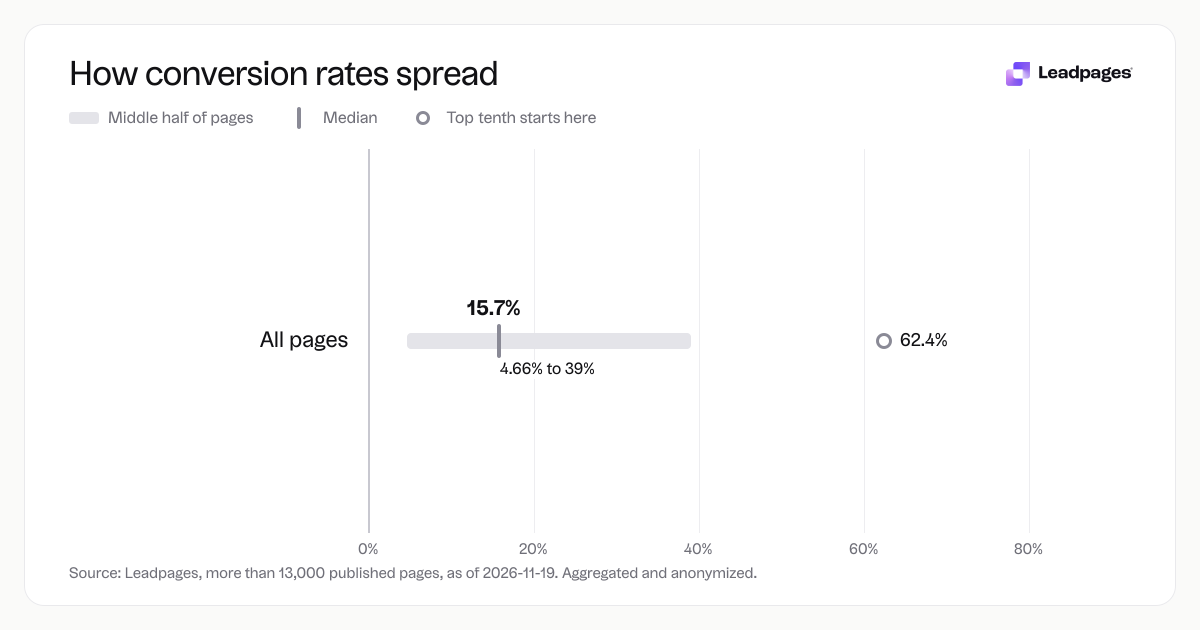
The top quarter of all pages convert above 39%. The top tenth convert above 62.4%. What those pages do is predictable: they remove friction and match the promise of the email.
Pages at the top tend to share a few traits. They use a headline that echoes the email subject line. They limit the form to only the fields they need — often just an email address. The call to action states exactly what the visitor gets, not a generic “Submit.” And they load fast on mobile, because a large share of email clicks come from phones.
You can close the gap with small, measurable changes. Test your headline against a few variants until one wins clearly. Use a free headline analyzer to score options before you publish. Run side-by-side experiments on your page copy, layout, or images with A/B testing and keep the version that lifts conversions. You don’t need a full redesign to move from average to the top quarter.
How to gauge your own email page performance
Start by finding your current conversion rate for each page you link to from email. Compare it to the medians above. If your squeeze page converts below 34.9%, you’re under the median for that type. If it’s below 4.66% — the bottom quarter threshold across all pages — your page almost certainly has a fixable issue, like a confusing headline or a form that asks for too much.
If your page converts above 39%, you’re in the top quarter. Keep that version as your control and try incremental improvements against it to push higher. Small, steady lifts compound over time and bring in more leads from the same email traffic.
Remember that these benchmarks reflect a wide distribution. The goal is to move from the majority into the top quarter, where every email click works harder.
Use the numbers as a diagnostic, not a final score. A low rate signals a clear test opportunity. A decent rate still has room to improve. Tools like the free landing page analyzer give you a page-level score and specific tweaks to try.
Where these numbers come from
We analyzed more than 13,000 published pages built with Leadpages. The data is aggregated and anonymized, pulled as of 2026-11-19. We calculated conversion rate as the percentage of page visitors who completed the goal action — usually a form submission or a button click — after arriving on the page. The medians and quartile figures reflect the actual performance range you can expect when you publish a page and drive traffic to it, including from email.
Score your landing page for free with the Leadpages Landing Page Analyzer. You’ll see where your page stands and which quick fixes could lift your email marketing conversion rate.