
Landing page benchmarks
What Button Text Converts Best? Real Data from 5,700+ Pages
The words on your button change your conversion rate. See what “download,” “get,” “book” and other labels convert at, based on 3 months of Leadpages data.
The words on your call-to-action button matter. Across pages published with Leadpages, conversion rates vary widely by button text. Here’s how each label performs, what high performers tend to do, and how to judge your own results.
Leadpages data
Form conversion rates for pages published with Leadpages, by what the button says, over the 90 days to 2026-11-16. A form conversion rate is the share of visits to a page in which the visitor submitted its form. Each figure is a median or quartile across pages. It describes the pages in a group, not what causes the difference between groups.
more than 5,700 published pagesAs of November 17, 2026
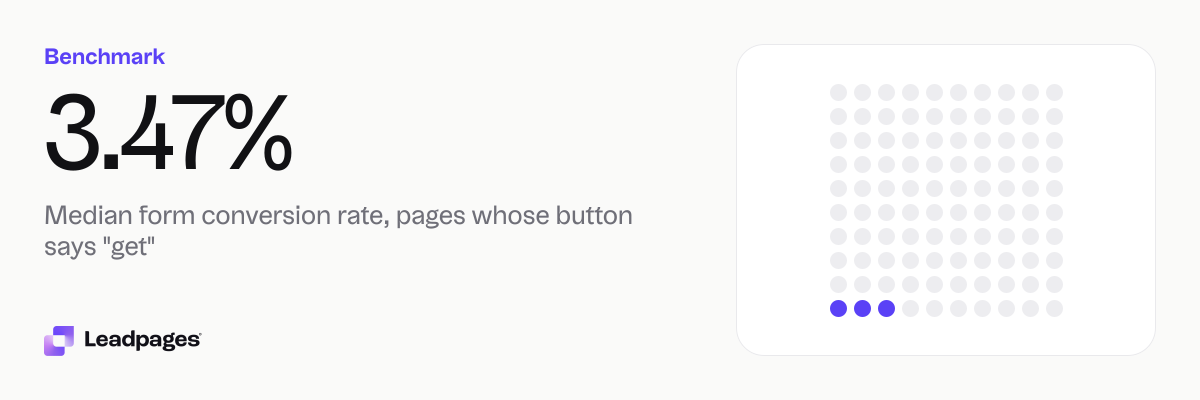
3.47%
Median form conversion rate, pages whose button says "get"
1.79%
Median form conversion rate, pages whose button says "start", "try" or "sign up"
1.6%
Median form conversion rate, pages whose button says "book" or "schedule"
| Measure | Value |
|---|---|
| Median form conversion rate, pages whose button says "get" | 3.47% |
| Median form conversion rate, pages whose button says "start", "try" or "sign up" | 1.79% |
| Median form conversion rate, pages whose button says "book" or "schedule" | 1.6% |
| Median form conversion rate, pages whose button says "download" | 16.2% |
| Median form conversion rate, pages whose button says "contact" or "call" | 0.88% |
| Median form conversion rate, pages with 1 call to action | 10.7% |
| Median form conversion rate, pages with 2 calls to action | 4.91% |
| Median form conversion rate, pages with 3 or more calls to action | 1.19% |
| Median form conversion rate, all pages | 1.96% |
Median form conversion rate, pages whose button says "get"
Median form conversion rate, pages whose button says "start", "try" or "sign up"
Median form conversion rate, pages whose button says "book" or "schedule"
Median form conversion rate, pages whose button says "download"
Median form conversion rate, pages whose button says "contact" or "call"
Median form conversion rate, pages with 1 call to action
Median form conversion rate, pages with 2 calls to action
Median form conversion rate, pages with 3 or more calls to action
Median form conversion rate, all pages
Based on more than 5,700 published pages. As of November 17, 2026.
How Button Text Changes Your Conversion Rate
We looked at the form conversion rate for every page published with Leadpages over 90 days and grouped them by what the button said. A form conversion rate is the share of visits where someone submitted the form on that page.
The gap between the groups is wide.
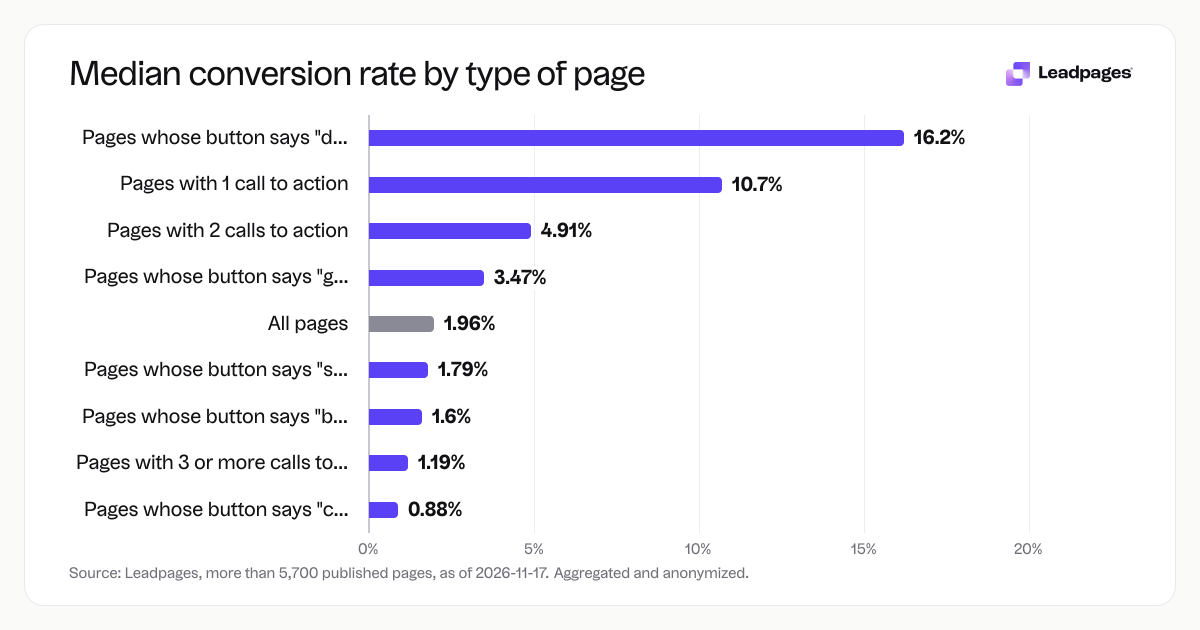
- “Download” buttons convert best. Pages whose button says “download” have a median form conversion rate of 16.2%. These pages usually trade a lead magnet, like a PDF or checklist, for an email address.
- “Get” buttons come next. Pages with “get” as their call to action convert at a median of 3.47%. “Get” is direct and signals the visitor will receive something specific.
- Free-trial language trails. Buttons labeled “start,” “try” or “sign up” have a median of 1.79%. These ask for a bigger commitment than a simple download.
- Booking language is lower still. Buttons with “book” or “schedule” see a median of 1.6%. Asking for calendar time is a heavier lift than grabbing content.
- “Contact” or “call” buttons convert the least. These pages have a median of 0.88%. Contact requests feel effortful, so visitors need a strong reason to submit a form.
These are medians, which means half the pages in each group performed above that number and half below. A specific page can beat the group median by a lot — especially if it does what the top quarter does.
What the Top Quarter Does Differently
A subset of pages in every button-text category converts far above the median. We can’t isolate causes, but two patterns show up in how high-performing pages are put together.
They use one call to action
Pages with a single call to action have a median form conversion rate of 10.7%. Add a second CTA and the median drops to 4.91%. Pages with three or more CTAs drop further to 1.19%.
Every extra choice splits attention. Top-quartile pages usually give the visitor one action. If the button says “download the guide,” the page doesn’t also ask them to book a demo or sign up for a newsletter.
They match the button to the promise
High-converting pages avoid generic labels like “submit.” The button text mirrors what the visitor gets. “Download the checklist” on a checklist page performs differently than “book a call” on the same layout. Clear labels set expectations and reduce friction.
They place the button after a clear argument
Top-quartile pages tend to answer four questions before the button: What is this? Who is it for? What will I get? Why should I believe it? You can sketch this structure with our landing page analyzer, which scores your page against patterns common in high-converting designs.
How to Read Your Own Number
A benchmark is a reference point, not a grade. Use these numbers to guide questions and tests, not to declare a page broken or fixed.
Start with your button’s job
Measure a “download” button on a lead magnet page against the 16.2% median. Measure a “book” button on a consultation page against 1.6%. These are different offers with different intent, so comparing them directly doesn’t help.
Watch the trend, not a single snapshot
Track your form conversion rate week over week. If it rises after you change the button text, you’re moving in the right direction. To compare versions, our A/B test calculator tells you when a result is statistically significant so you don’t act on noise.
Check your CTA count before you touch the text
If your page has three calls to action, changing “contact” to “download” helps less than cutting down to one. Simplify first, then refine copy. You can build a single-CTA page with the Leadpages landing page builder and test variations with built-in A/B testing.
Run a focused test
Pick one button-text variation and split your traffic evenly. Measure form submissions, not clicks. If you need help writing options, the free call-to-action generator suggests button copy based on your offer, so you can test quickly without starting from scratch.
How We Measured This
We pulled form conversion rates from more than 5,700 pages published with Leadpages over the 90 days ending November 16, 2026. A form conversion rate is the percentage of visits to a page where a visitor submitted its form. All data is aggregated and anonymized.
We grouped pages by what text appeared on their main call-to-action button. Every number you see is a median across pages in that group. It describes the center of that group — not what causes the difference between groups. The top quarter of pages in every group converts well above the median. The bottom quarter converts below it.
The overall median across all pages, regardless of button text, is 1.96%.
You can also dig into related benchmarks on how CTA placement affects conversion and how the number of form fields changes submissions.