
Landing page benchmarks
Conversion Rate Optimization Expert: Benchmarks from 13,000+ Landing Pages
See median conversion rates from 13,000+ Leadpages landing pages. Benchmarks by industry and page type, so you can spot what a top-performing page looks like.
As a conversion rate optimization expert, you know every audience, offer, and page behaves differently. Still, industry benchmarks help you judge whether you’re in range—and what’s possible. Across more than 13,000 pages published with Leadpages, the median conversion rate for all pages is 15.7%. Below, you’ll see how that number breaks down so you can compare your work to real performance data and decide where to focus next.
Leadpages data
Conversion rates for pages published with Leadpages, by industry and page type
more than 13,000 published pagesAs of November 19, 2026
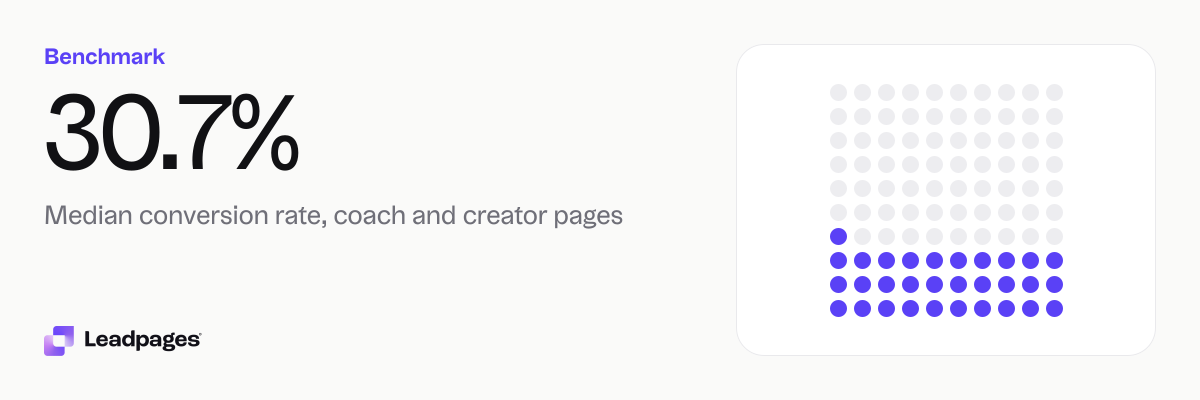
30.7%
Median conversion rate, coach and creator pages
19.8%
Median conversion rate, education pages
11.2%
Median conversion rate, healthcare pages
| Measure | Value |
|---|---|
| Median conversion rate, coach and creator pages | 30.7% |
| Median conversion rate, education pages | 19.8% |
| Median conversion rate, healthcare pages | 11.2% |
| Median conversion rate, finance pages | 14.9% |
| Median conversion rate, ecommerce pages | 6.84% |
| Median conversion rate, real estate pages | 9.65% |
| Median conversion rate, local service pages | 8.22% |
| Median conversion rate, squeeze and opt-in pages | 34.9% |
| Median conversion rate, webinar registration pages | 29.2% |
| Median conversion rate, landing pages | 15.6% |
| Median conversion rate, product pages | 9.25% |
| Median conversion rate, sales pages | 6.97% |
| Median conversion rate, all pages | 15.7% |
| Bottom quarter converts below, all pages | 4.66% |
| Top quarter converts above, all pages | 39% |
| Top tenth converts above, all pages | 62.4% |
| Share converting at 10% or better, all pages | 59.9% |
Median conversion rate, coach and creator pages
Median conversion rate, education pages
Median conversion rate, healthcare pages
Median conversion rate, finance pages
Median conversion rate, ecommerce pages
Median conversion rate, real estate pages
Median conversion rate, local service pages
Median conversion rate, squeeze and opt-in pages
Median conversion rate, webinar registration pages
Median conversion rate, landing pages
Median conversion rate, product pages
Median conversion rate, sales pages
Median conversion rate, all pages
Bottom quarter converts below, all pages
Top quarter converts above, all pages
Top tenth converts above, all pages
Share converting at 10% or better, all pages
Based on more than 13,000 published pages. As of November 19, 2026.
What Median Conversion Rates Look Like
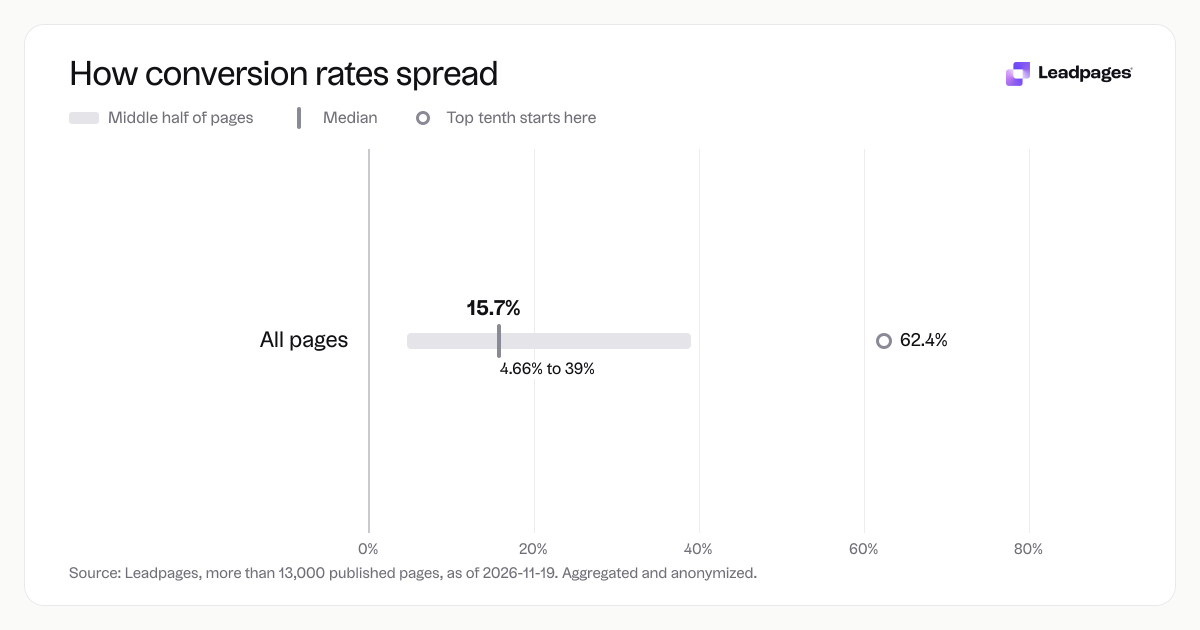
The overall median across every page in our sample is 15.7%. That number matters more once you see how rates spread:
- 59.9% of all pages convert at a double-digit rate or better.
- The bottom quarter of pages converts below 4.66%.
- The top quarter converts above 39%.
- The top tenth converts above 62.4%.
Conversion rate optimization experts treat 15.7% as a reference point, not a target. The clearer signal comes from comparing rates by industry and page type—because a webinar registration page and a sales page behave very differently.
How Rates Break Down by Industry and Page Type
Grouped by the kind of business the page serves, median conversion rates vary widely:
- Coach and creator pages: 30.7%
- Education pages: 19.8%
- Finance pages: 14.9%
- Healthcare pages: 11.2%
- Real estate pages: 9.65%
- Local service pages: 8.22%
- Ecommerce pages: 6.84%
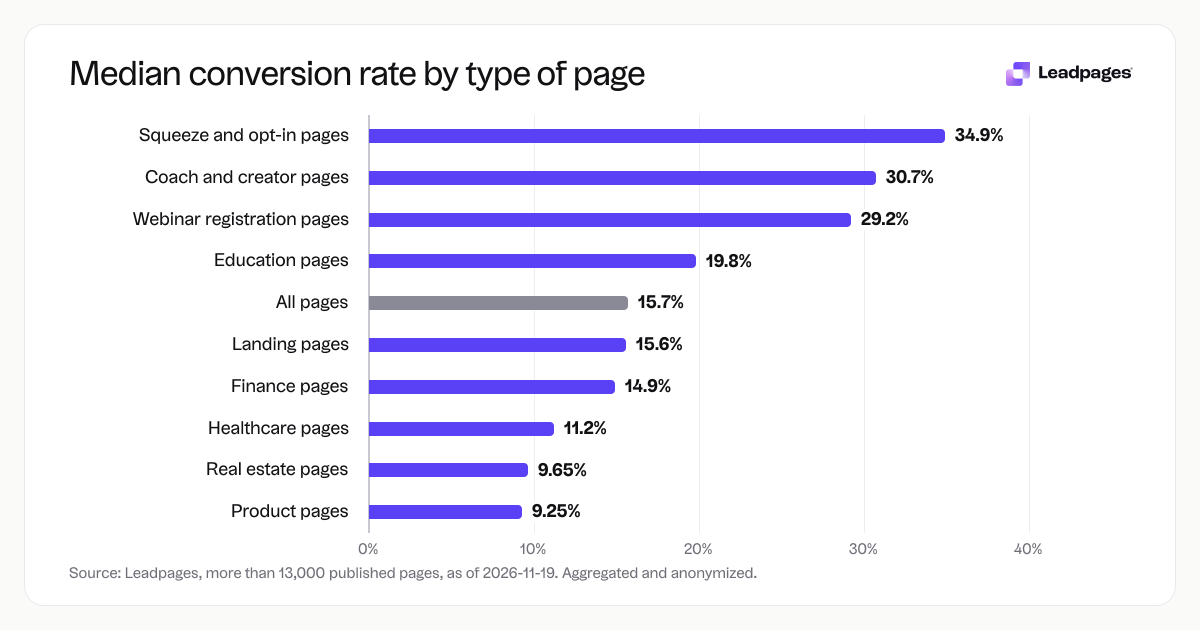
The pattern is consistent: offers built on expertise, transformation, or a high‑intent service tend to convert at higher medians than pages selling commoditized products or broad price‑comparison services. Page type within the same industry also drives big swings. Here are the medians by page type across all industries:
- Squeeze and opt‑in pages: 34.9%
- Webinar registration pages: 29.2%
- Landing pages: 15.6%
- Product pages: 9.25%
- Sales pages: 6.97%
Knowing both industry and page type gives you a sharper benchmark. A sales page for an ecommerce brand and a sales page for a coach live in very different conversion climates. Use the breakdown to set a realistic starting point, not as a pass‑or‑fail label.
What the Top Quarter Does Differently
Pages in the top quarter—those converting above 39%—don’t succeed by accident. Our data shows they share a few practical habits you can apply right away:
- They run A/B tests regularly. Small, deliberate changes to headlines, button text, and form length show what moves the needle. See how A/B testing works in Leadpages
- They keep the ask focused. Top opt‑in pages use a single clear headline and one straightforward call to action, instead of covering multiple offers.
- They optimize for mobile. Fast load times and scannable content on a phone remove friction before the visitor bounces.
- They use social proof, specifics, and low‑risk language on the call to action. A generic “Submit” button underperforms a benefit‑led phrase.
The top tenth of pages, converting above 62.4%, layer these habits tightly. They don’t rely on one big redesign—they test, tune, and climb step by step. For a quick way to spot weak points, run your headline through a free headline analyzer and check how clear your promise is.
How to Interpret Your Own Conversion Rate
Benchmarks show the range, but your rate lives in your own context: traffic source, price point, brand familiarity, and the action you’re asking for. A conversion rate optimization expert uses these medians to ask better questions, not to judge a page against an abstract average.
Start by checking where your page sits relative to its industry and type. If it’s below the median, don’t panic—look at traffic quality first. Then pick one element to test, like the call to action or the form fields, and measure the result.
To get a fast read on how your page stacks up, drop its URL into the free landing page analyzer. You’ll get a score and specific, practical suggestions you can act on today.
How We Measured This
These numbers come from an anonymized, aggregated analysis of more than 13,000 pages published with Leadpages, as of 2026-11-19. For each page, we calculated the conversion rate and then took the median across the entire group and within each industry and page-type segment. The bottom quarter, top quarter, and top tenth cutoffs represent where the distribution falls, not averages. The sample covers a mix of organic, paid, and direct traffic, reflecting what real small‑business owners and marketers experience every day.
Score your landing page with the free Landing Page Analyzer to see how it stacks up.