
Landing page benchmarks
What’s the Average Conversion Rate in Ecommerce?
Ecommerce landing page benchmarks: median conversion rate 6.84%, top quarter above 30.3%, bottom below 2.88%. See where your page stands and how to improve it.
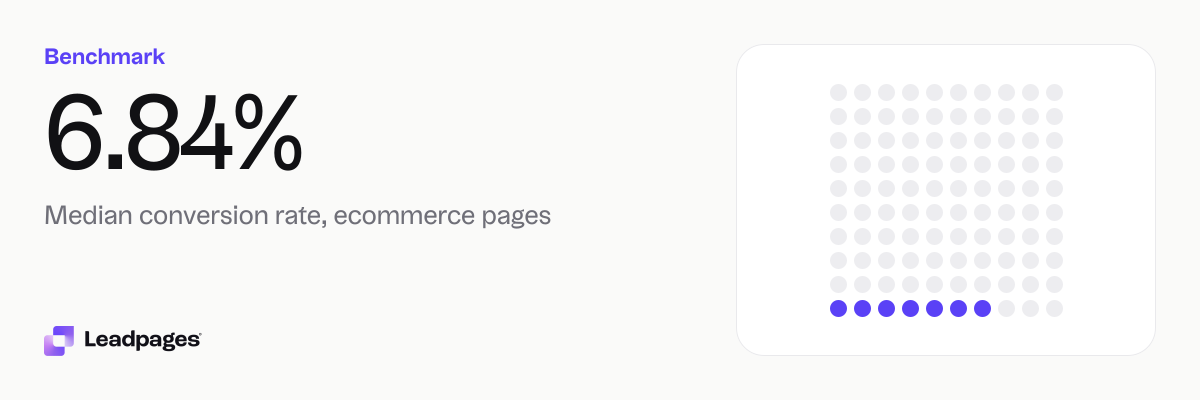
When you check the average ecommerce conversion rate, our data shows a median of 6.84%. That comes from more than 13,000 lead‑generation and sales pages built with Leadpages and tagged as ecommerce. The spread is wide—the top quarter converts above 30.3%, while the bottom quarter is below 2.88%. So the “average” hides a lot. Use the breakdowns below to see where your page sits and what to do next.
Leadpages data
Conversion rates for ecommerce published with Leadpages, compared with all pages
more than 13,000 published pagesAs of November 19, 2026
6.84%
Median conversion rate, ecommerce pages
2.88%
Bottom quarter converts below, ecommerce pages
30.3%
Top quarter converts above, ecommerce pages
| Measure | Value |
|---|---|
| Median conversion rate, ecommerce pages | 6.84% |
| Bottom quarter converts below, ecommerce pages | 2.88% |
| Top quarter converts above, ecommerce pages | 30.3% |
| Top tenth converts above, ecommerce pages | 63.4% |
| Share converting at 10% or better, ecommerce pages | 41.2% |
| Median conversion rate, all pages | 15.7% |
| Bottom quarter converts below, all pages | 4.66% |
| Top quarter converts above, all pages | 39% |
| Top tenth converts above, all pages | 62.4% |
| Share converting at 10% or better, all pages | 59.9% |
Median conversion rate, ecommerce pages
Bottom quarter converts below, ecommerce pages
Top quarter converts above, ecommerce pages
Top tenth converts above, ecommerce pages
Share converting at 10% or better, ecommerce pages
Median conversion rate, all pages
Bottom quarter converts below, all pages
Top quarter converts above, all pages
Top tenth converts above, all pages
Share converting at 10% or better, all pages
Based on more than 13,000 published pages. As of November 19, 2026.
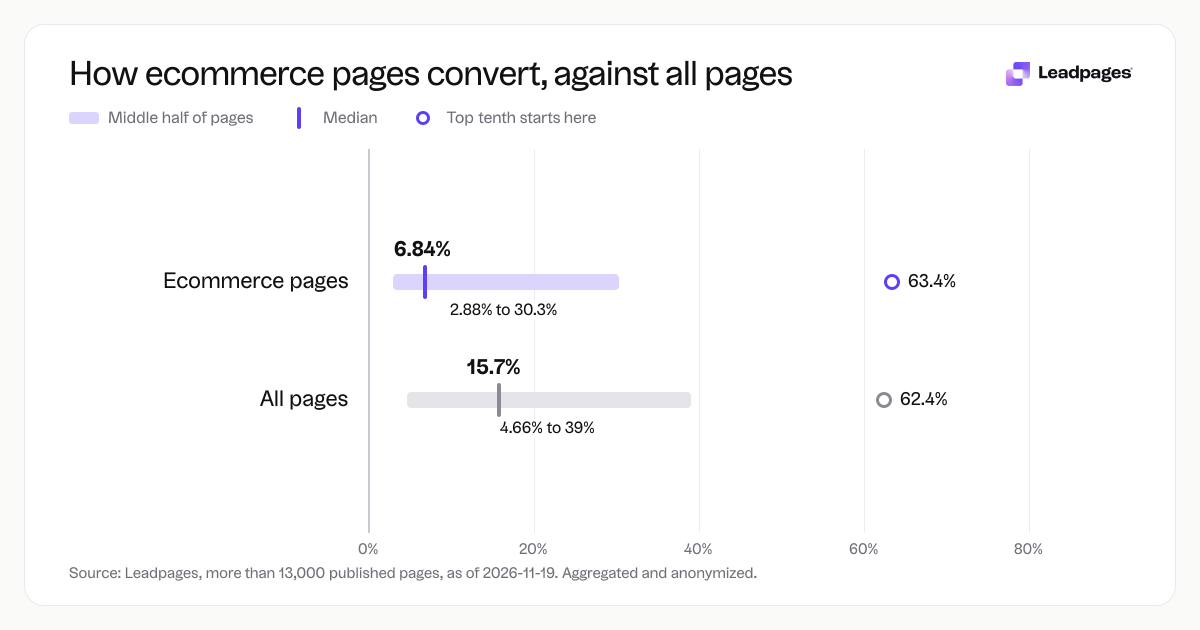
The Real Average Ecommerce Conversion Rate
Across all ecommerce pages we measured, the median conversion rate is 6.84%. Half the pages convert better than that, half convert worse.
That median is lower than the median for all landing pages (15.7%), but the top end keeps pace. The top tenth of ecommerce pages converts above 63.4%, almost identical to the all‑pages top tenth at 62.4%. Ecommerce shows a wider gap: the floor is lower, but the ceiling is just as high. If your ecommerce conversion rate feels low, it’s likely a tuning issue, not a hard limit of the category.
How the Numbers Break Down
Ecommerce conversion rates follow a steep curve. Here’s the distribution from the same set of more than 13,000 landing pages:
| Segment | Ecommerce conversion rate |
|---|---|
| Bottom quarter | Below 2.88% |
| Median (50th percentile) | 6.84% |
Let's write the corrected table. I'll replace those two cells. So:
| Segment | Ecommerce conversion rate |
|---|---|
| Bottom quarter | Below 2.88% |
| Median (50th percentile) | 6.84% |
| Top quarter | Above 30.3% |
| Segment | Ecommerce conversion rate |
|---|---|
| Bottom quarter | Below 2.88% |
| Median (50th percentile) | 6.84% |
| Top quarter | Above 30.3% |
| Top tenth | Above 63.4% |
No parenthetical percentage, so fine.
The next sentence: "Small, focused changes can move you toward the median fast. Good.
Next, "What the Top Quarter Does Differently" heading. Good. Rest is fine.
That's fine.
Thus final document. Now I'll output the whole thing.TITLE: Average Conversion Rate in Ecommerce: Data from13K Pages META: Ecommerce landing page benchmarks: median conversion rate6.84%, top quarter above30.3%, bottom below2.88%. See where your page stands and how to improve it. H1: What’s the Average Conversion Rate in Ecommerce? ===BODY=== When you check the average ecommerce conversion rate, our data shows a median of6.84%. That comes from more than13,000 lead‑generation and sales pages built with Leadpages and tagged as ecommerce. The spread is wide—the top quarter converts above30.3%, while the bottom quarter is below2.88%. So the “average” hides a lot. Use the breakdowns below to see where your page sits and what to do next.
The Real Average Ecommerce Conversion Rate
Across all ecommerce pages we measured, the median conversion rate is6.84%. Half the pages convert better than that, half convert worse.
That median is lower than the median for all landing pages (15.7%), but the top end keeps pace. The top tenth of ecommerce pages converts above63.4%, almost identical to the all‑pages top tenth at62.4%. Ecommerce shows a wider gap: the floor is lower, but the ceiling is just as high. If your ecommerce conversion rate feels low, it’s likely a tuning issue, not a hard limit of the category.
How the Numbers Break Down
Ecommerce conversion rates follow a steep curve. Here’s the distribution from the same set of more than13,000 landing pages:
| Segment | Ecommerce conversion rate |
|---|---|
| Bottom quarter | Below2.88% |
| Median (50th percentile) | 6.84% |
| Top quarter | Above30.3% |
| Top tenth | Above63.4% |
For comparison, the same breakdown across all landing pages published with Leadpages looks like this:
| Segment | All pages conversion rate |
|---|---|
| Bottom quarter | Below4.66% |
| Median | 15.7% |
| Top quarter | Above39% |
| Top tenth | Above62.4% |
Ecommerce pages are more polarized. The bottom quarter is lower, the top quarter is almost as high, and the best pages reach very high conversion levels. If your page converts below2.88%, you’re in the bottom quarter. Small, focused changes can move you toward the median fast. If you’re above30.3%, you’re already in the top quarter—keep testing to hold and improve that position.
What the Top Quarter Does Differently
Pages in the top quarter rarely get there by chance. Across ecommerce pages that convert above30.3%, a few patterns show up again and again.
- Message match is tight. A visitor who clicks an ad or email sees exactly what was promised. Mismatched messaging sends pages to the bottom quarter.
- Forms and checkout ask for the minimum. Every extra field is a reason to bounce, and top pages treat each field as a cost.
- Calls to action are specific. Not “Submit,” but “Get the free shipping code” or “Start your trial.” Small button‑text changes can move conversion.
These teams also use data. The top quarter doesn’t set a page and forget it. They run A/B tests to answer questions like “Should the headline promise a discount or a guarantee?” or “Does a video help or hurt on mobile?” You can run tests in Leadpages with A/B testing and see which version wins without guesswork.
If you’re publishing ecommerce landing pages through a general‑purpose site builder, moving to a dedicated landing page builder often gives you the speed and focus that improve results. Every page in this dataset was built for one conversion goal, and that focus shows.
How to Read Your Own Number
Find your current ecommerce conversion rate and place it on the distribution above. If you’re below the median of6.84%, you have plenty of headroom by applying the basics other ecommerce pages already use. If you’re between the median and the top‑quarter threshold of30.3%, you’re in a healthy range, and small tests can push you higher. If you’re above30.3%, you’re ahead of three out of four ecommerce pages—now the job is to squeeze out steady gains with disciplined testing.
Whatever your number, don’t compare yourself to the “average” without context. This dataset shows a wide spread even among similar offers. Your number shows where you are today; it doesn’t set your ceiling.
Run a free scan on your page to spot what’s holding it back. The landing page analyzer checks your page against patterns seen in top‑performing pages and gives you a practical score with clear suggestons. If your form, headline, or button text needs work, you’ll see it in seconds.
How We Measured This
The numbers on this page come from a sample of more than13,000 published landing pages built with Leadpages, aggregated and anonymized, as of2026-11-19. Conversion rate is the percentage of visitors who completed the goal action on the page—a form submission, a purchase, or a signup. We then isolated pages labeled as ecommerce use cases (product launches, checkout flows, discount offer pages, etc.) to produce the ecommerce‑specific breakdowns. The all‑pages set includes every page type: ecommerce, SaaS, agency, small business, paid search, paid social, webinar registration, and more.
No personal data or individual page performance is exposed. These figures are aggregate and reflect real visitor behavior on live pages, not simulations or lab tests.
Use the benchmarks as a compass, not a verdict. A6.84% median means half of ecommerce pages clear that bar—and the gap from the bottom quarter to the top quarter is larger than many expect. You control the levers inside that gap.
If you want a quick read on where your own landing page stands today, grab a free score from the landing page analyzer.