
Landing page benchmarks
Call to Action Conversion Rate: Benchmarks from 5,700+ Pages
What is a good call to action conversion rate? See real data from over 5,700 landing pages—broken down by CTA count, button text, and placement.
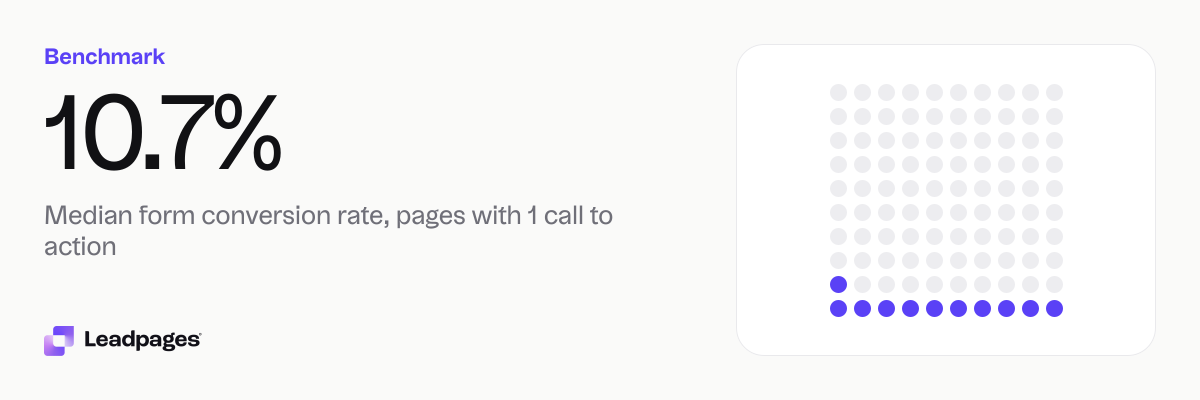
A call to action conversion rate is the share of visitors who complete the action you ask for—on a form page, that’s a form submission. Across more than 5,700 landing pages published with Leadpages and studied in late 2026, the overall median conversion rate was 1.96%. That single number hides a wide spread: pages with one call to action convert far higher than pages that split attention across two, three, or more.
Leadpages data
Form conversion rates for pages published with Leadpages, by number of calls to action, over the 90 days to 2026-11-16. A form conversion rate is the share of visits to a page in which the visitor submitted its form. Each figure is a median or quartile across pages. It describes the pages in a group, not what causes the difference between groups.
more than 5,700 published pagesAs of November 17, 2026
10.7%
Median form conversion rate, pages with 1 call to action
1.34%
Bottom quarter converts below, pages with 1 call to action
34.2%
Top quarter converts above, pages with 1 call to action
| Measure | Value |
|---|---|
| Median form conversion rate, pages with 1 call to action | 10.7% |
| Bottom quarter converts below, pages with 1 call to action | 1.34% |
| Top quarter converts above, pages with 1 call to action | 34.2% |
| Top tenth converts above, pages with 1 call to action | 55.7% |
| Median form conversion rate, pages with 2 calls to action | 4.91% |
| Bottom quarter converts below, pages with 2 calls to action | 0.92% |
| Top quarter converts above, pages with 2 calls to action | 18.8% |
| Top tenth converts above, pages with 2 calls to action | 37.5% |
| Median form conversion rate, pages with 3 or more calls to action | 1.19% |
| Bottom quarter converts below, pages with 3 or more calls to action | 0.12% |
| Top quarter converts above, pages with 3 or more calls to action | 4.98% |
| Top tenth converts above, pages with 3 or more calls to action | 19.7% |
| Median form conversion rate, pages with a call to action in the first section | 2.46% |
| Median form conversion rate, pages whose first call to action is further down | 1.37% |
| Median form conversion rate, pages whose button says "get" | 3.47% |
| Median form conversion rate, pages whose button says "start", "try" or "sign up" | 1.79% |
| Median form conversion rate, pages whose button says "book" or "schedule" | 1.6% |
| Median form conversion rate, pages whose button says "download" | 16.2% |
| Median form conversion rate, pages whose button says "contact" or "call" | 0.88% |
| Median form conversion rate, all pages | 1.96% |
Median form conversion rate, pages with 1 call to action
Bottom quarter converts below, pages with 1 call to action
Top quarter converts above, pages with 1 call to action
Top tenth converts above, pages with 1 call to action
Median form conversion rate, pages with 2 calls to action
Bottom quarter converts below, pages with 2 calls to action
Top quarter converts above, pages with 2 calls to action
Top tenth converts above, pages with 2 calls to action
Median form conversion rate, pages with 3 or more calls to action
Bottom quarter converts below, pages with 3 or more calls to action
Top quarter converts above, pages with 3 or more calls to action
Top tenth converts above, pages with 3 or more calls to action
Median form conversion rate, pages with a call to action in the first section
Median form conversion rate, pages whose first call to action is further down
Median form conversion rate, pages whose button says "get"
Median form conversion rate, pages whose button says "start", "try" or "sign up"
Median form conversion rate, pages whose button says "book" or "schedule"
Median form conversion rate, pages whose button says "download"
Median form conversion rate, pages whose button says "contact" or "call"
Median form conversion rate, all pages
Based on more than 5,700 published pages. As of November 17, 2026.
What’s a Good Call to Action Conversion Rate?
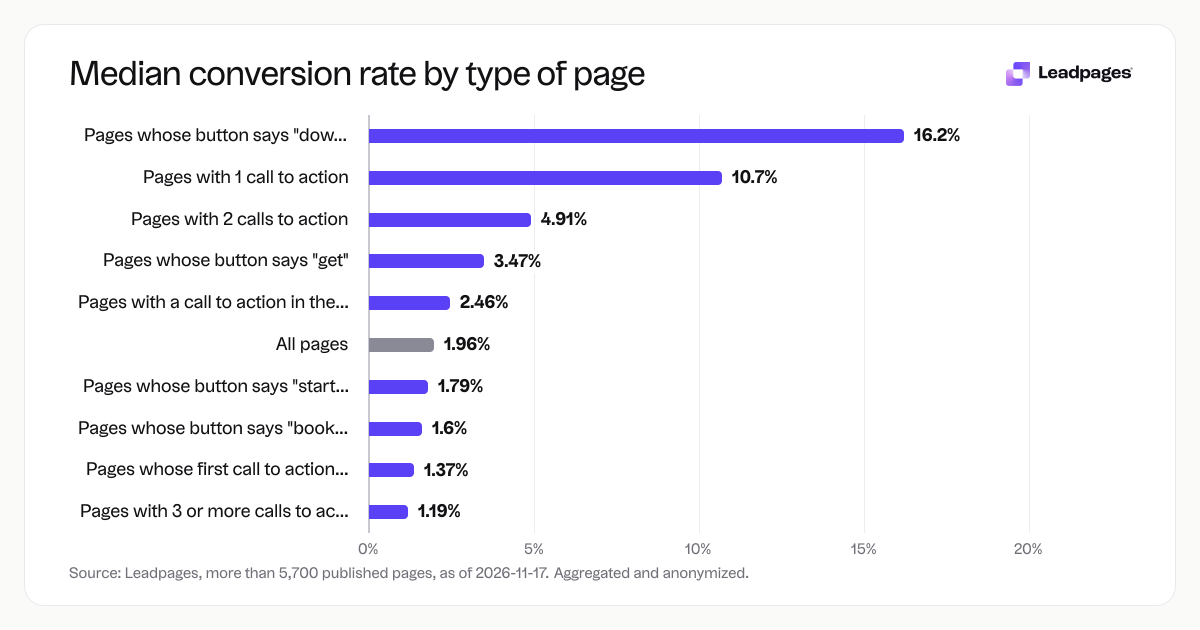
Across the whole set, the median page turned 1.96% of visits into a form submission. But “good” depends on how you structure the page.
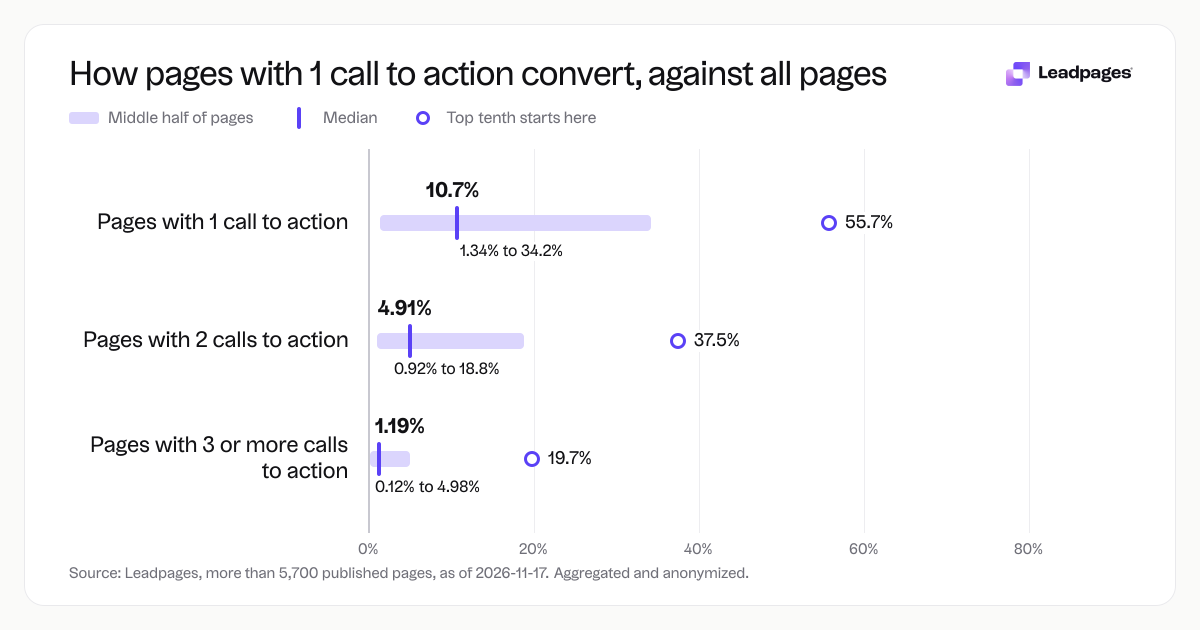
Pages with one call to action saw a median conversion rate of 10.7%. That’s a better comparison point for most small businesses using a simple, focused landing page.
As you add more calls to action, the median rate falls. Pages with two CTAs converted at a median 4.91%, and pages with three or more dropped to 1.19%. The pattern is consistent: every extra ask pushes the median down.
That doesn’t make multi-CTA pages failures. Their job is often different—for example, offering a few ways to engage—so the average visit is less likely to end in a form submission.
How the Numbers Break Down
Here’s how conversion rates shift when you change the number of calls to action, where you place them, and what the button says. Every figure comes from real landing pages published with Leadpages, measured over the 90 days to November 16, 2026.
Conversion Rate by Number of CTAs
1 call to action
- Median: 10.7%
- Bottom quarter of pages converts below: 1.34%
- Top quarter converts above: 34.2%
- Top tenth converts above: 55.7%
2 calls to action
- Median: 4.91%
- Bottom quarter converts below: 0.92%
- Top quarter converts above: 18.8%
- Top tenth converts above: 37.5%
3 or more calls to action
- Median: 1.19%
- Bottom quarter converts below: 0.12%
- Top quarter converts above: 4.98%
- Top tenth converts above: 19.7%
Notice the top tenth of single-CTA pages convert above 55.7%. That’s not an average; it’s the top-performing minority. It shows what’s possible when everything on a page points to one outcome.
Where You Place the Call to Action
Pages with the first call to action in the opening section (what most people call above the fold) had a median conversion rate of 2.46%. When the first CTA appeared further down the page, the median dropped to 1.37%.
This doesn’t mean the first section always wins for every audience. But across thousands of pages, making the ask immediately visible correlated with more submissions.
What the Button Says
Button text is one of the most controllable parts of a CTA, and the medians varied widely:
- Button text that includes “download”: median 16.2%
- Button text that includes “get”: median 3.47%
- Button text that includes “start,” “try,” or “sign up”: median 1.79%
- Button text that includes “book” or “schedule”: median 1.6%
- Button text that includes “contact” or “call”: median 0.88%
The 16.2% median for “download” buttons fits the offer: a download usually trades an email for a clear asset—a checklist, guide, or template—so the next step is obvious. The lower medians for “contact” and “call” likely reflect softer asks or higher‑commitment actions. Every CTA sets up what happens next. To sharpen your copy, read our guide on how to write a call to action that converts.
What the Top Quarter Does Differently
If you isolate the top quarter of pages within each group, a few patterns show up. These aren’t causes—the data describes pages, not what made them convert—but they’re consistent enough to use.
The highest‑converting single‑CTA pages (above 34.2%) tend to do three things: make one specific ask, place that ask in the first visible section, and match the button text tightly to the offer. A page offering a PDF guide with a “Download the guide” button sits squarely in that cluster.
For two‑CTA pages, the top quarter (converting above 18.8%) still features one clear primary action, with the second as a lighter link—like “learn more” or a menu item—that doesn’t compete with the form. Pages that give two actions equal weight often split attention and underperform that group.
Across all CTA counts, the top tenth shows the ceiling. A single‑CTA page can convert above 55.7%. That’s not typical, but it’s real.
To get a quick read on your page today, run it through the free landing page analyzer for guidance on what helps or hurts your flow.
How to Read Your Own Number
Your call to action conversion rate only matters when you compare it to the right benchmark. Start with your page’s CTA count. If you use one CTA, the 10.7% median is a reasonable baseline. If you’re above 10.7%, you’re ahead of half the field; if you’re approaching 34.2%, you’re in the top quarter.
Then check placement. If your CTA sits below a headline, a paragraph, and an image, moving it up could lift your rate toward the 2.46% median for early‑CTA pages.
Next, check the button text. If you use “download” because you offer a resource, that median of 16.2% is your closest reference.
After that, test. Leadpages includes built‑in A/B testing so you can run experiments against your own baseline and see which version gets more form submissions. Small changes—button wording, CTA position, removing a competing link—can move the number. If you’re not ready for a full A/B test, use the A/B test significance calculator to size up a change before you commit traffic.
How We Measured This
These numbers come from more than 5,700 published landing pages that were live on Leadpages and collected form submissions during the 90 days through November 16, 2026. The data was aggregated and anonymized as of November 17, 2026.
We measured form conversion rate: the share of visits to a page in which the visitor submitted the page’s form. All figures are medians or quartile boundaries across pages, not averages. The quartile numbers show the range: the bottom quarter converts below that threshold, and the top quarter converts above it.
Because the data is split by the number of calls to action—and further by placement and button text—each median describes a specific group of pages. It doesn’t say one design caused a higher rate, only what the rates were for pages with those characteristics.
If you’re publishing pages with Leadpages, you can track these same metrics in your account and see how your pages stack up.
To get a personalized score and clear suggestions for your page, use the free landing page analyzer. It reviews your page against proven conversion principles and gives you a focused starting point for improvements.