
Landing page benchmarks
How to Improve Conversion Rate with Real-World Benchmarks
Learn how to improve conversion rate with data from over 13,000 pages. See industry benchmarks, top‑quarter habits, and a step‑by‑step way to lift your own numbers.
The fastest way to improve conversion rate is to see where you stand, then test changes that make your page simpler and more direct. A “good” rate varies by industry, so we pulled data from more than 13,000 pages published with Leadpages. Use these benchmarks to set your baseline, then apply the habits top‑quarter pages use to convert above 39%.
Leadpages data
Conversion rates for pages published with Leadpages, by industry and page type
more than 13,000 published pagesAs of November 16, 2026
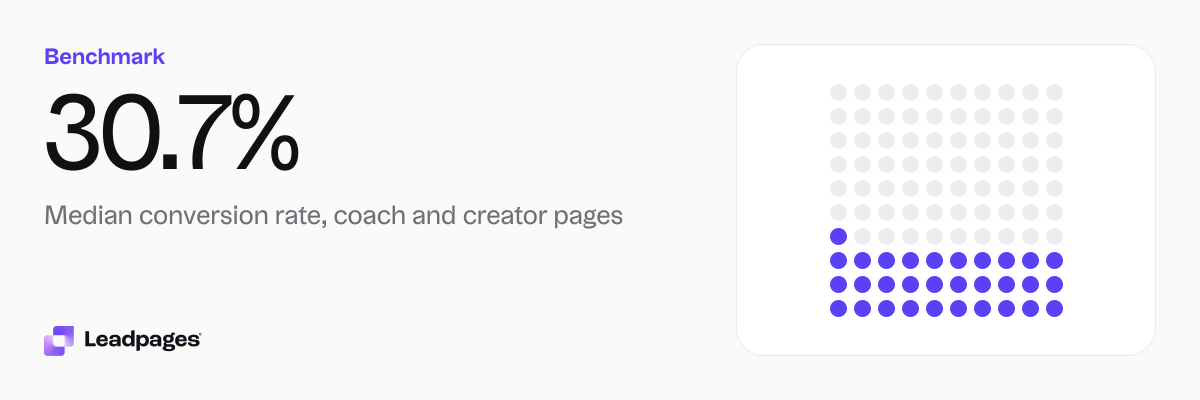
30.7%
Median conversion rate, coach and creator pages
19.8%
Median conversion rate, education pages
11.2%
Median conversion rate, healthcare pages
| Measure | Value |
|---|---|
| Median conversion rate, coach and creator pages | 30.7% |
| Median conversion rate, education pages | 19.8% |
| Median conversion rate, healthcare pages | 11.2% |
| Median conversion rate, finance pages | 14.9% |
| Median conversion rate, ecommerce pages | 6.84% |
| Median conversion rate, real estate pages | 9.65% |
| Median conversion rate, local service pages | 8.22% |
| Median conversion rate, squeeze and opt-in pages | 34.9% |
| Median conversion rate, webinar registration pages | 29.2% |
| Median conversion rate, landing pages | 15.6% |
| Median conversion rate, product pages | 9.25% |
| Median conversion rate, sales pages | 6.97% |
| Median conversion rate, all pages | 15.7% |
| Bottom quarter converts below, all pages | 4.66% |
| Top quarter converts above, all pages | 39% |
| Top tenth converts above, all pages | 62.4% |
| Share converting at 10% or better, all pages | 59.9% |
Median conversion rate, coach and creator pages
Median conversion rate, education pages
Median conversion rate, healthcare pages
Median conversion rate, finance pages
Median conversion rate, ecommerce pages
Median conversion rate, real estate pages
Median conversion rate, local service pages
Median conversion rate, squeeze and opt-in pages
Median conversion rate, webinar registration pages
Median conversion rate, landing pages
Median conversion rate, product pages
Median conversion rate, sales pages
Median conversion rate, all pages
Bottom quarter converts below, all pages
Top quarter converts above, all pages
Top tenth converts above, all pages
Share converting at 10% or better, all pages
Based on more than 13,000 published pages. As of November 16, 2026.
Benchmark your conversion rate by industry and page type
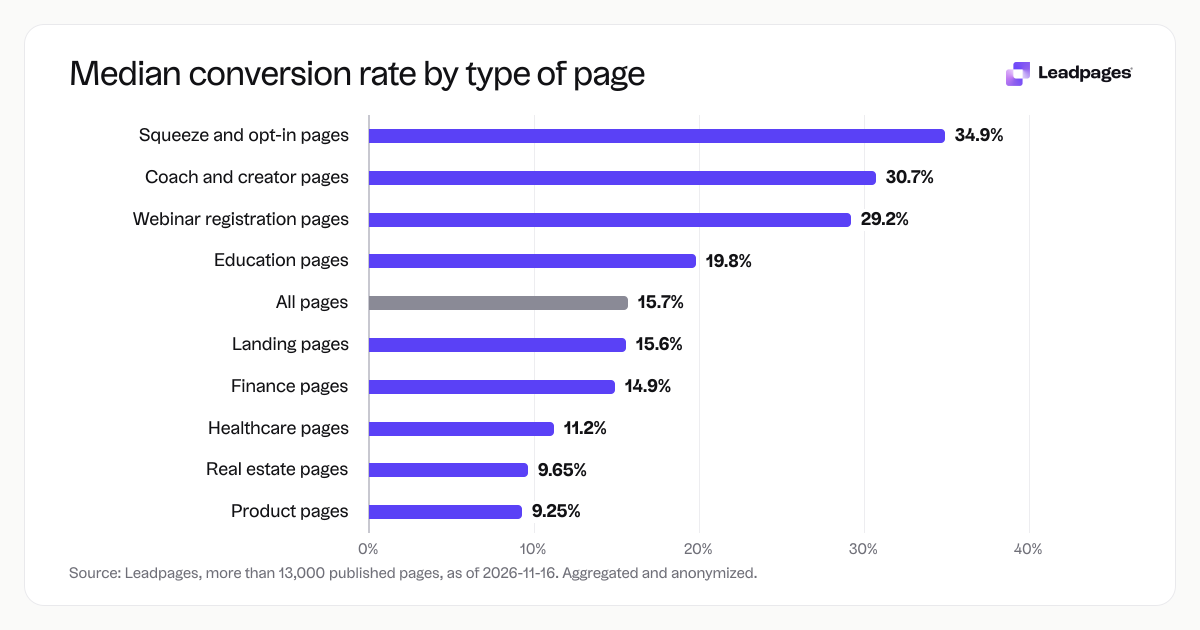
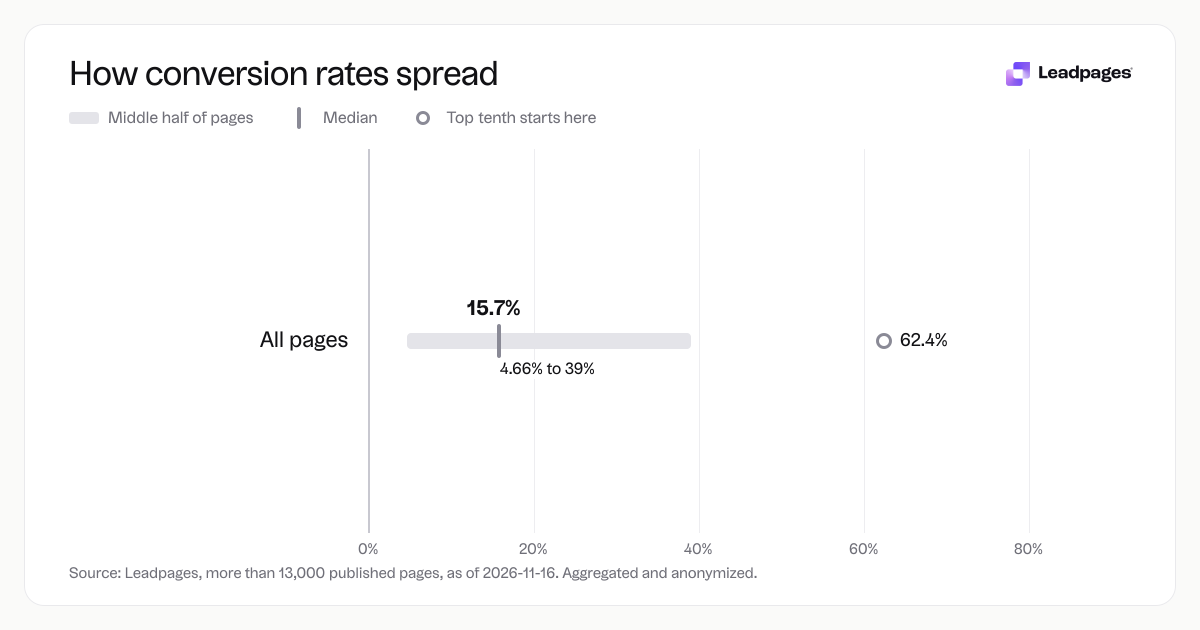
Across all pages in our sample, the median conversion rate is 15.7%. Half of pages do better, half worse. Medians change a lot based on what you sell and the kind of page you run.
Industry medians give you the closest comparison. Here’s how to improve conversion rates for your specific field:
- Coach and creator pages: 30.7%
- Education pages: 19.8%
- Healthcare pages: 11.2%
- Finance pages: 14.9%
- Ecommerce pages: 6.84%
- Real estate pages: 9.65%
- Local service pages: 8.22%
Page‑type medians show how intent shapes the number:
- Squeeze and opt‑in pages: 34.9%
- Webinar registration pages: 29.2%
- Landing pages (lead gen): 15.6%
- Product pages: 9.25%
- Sales pages: 6.97%
Squeeze and webinar pages convert higher because the ask is small (an email for a freebie or seat). Sales pages, where a visitor has to pull out a credit card, naturally convert lower. Don’t compare your webinar registration page to a product page—match like for like.
If you’re not there yet, you have clear room to improve conversion rate.
What high‑converting pages do differently
We looked at the spread. Pages in the bottom quarter convert below 4.66%. The top quarter converts above 39%, and the top tenth goes above 62.4%. The gap isn’t magic—it comes from a few disciplined choices.
They remove everything that isn’t the next step. Top‑quarter landing pages cut navigation menus, sidebars, and outbound links except the call to action. Every element either supports the offer or goes.
Their headlines match the source. A visitor who clicks a promise about a “free SEO audit” should see that exact phrase at the top of the page. High‑converting pages keep the message consistent from ad or email to headline. You can test yours with our headline analyzer to check for clarity and specificity.
They use one call to action, repeated. A single CTA button, repeated once or twice down the page, reduces decision fatigue. The button says what happens next, not just “submit.” For example, “Send me the checklist” beats “Get started.” Try a few variations with the call‑to‑action generator if you’re stuck.
They capture leads with a focused form. Short forms—often just an email field—keep friction low. If you need more info, ask later. Tools like the lead capture forms in Leadpages let you add multi‑step forms that feel light but still collect what you need.
A/B testing one element at a time shows what actually lifts conversions, and the A/B test calculator tells you when a result is real, not random. The process is steady, and it compounds.
None of this requires a redesign or a bigger ad budget. The pages converting above 39% aren’t slicker—they’re just more direct.
How to read your own conversion rate
Your conversion rate is simple: conversions divided by unique visitors, shown as a percentage.
Compare that number to the medians above, but use them as a guide, not a final score. A finance firm at 14.9% is on the median; a real estate agent at the same rate is outperforming their field by a wide margin. The most productive way to improve conversion rates is to measure against your own past performance.
Start by running your page through the landing page analyzer. It checks for common leaks—vague headlines, slow load times, mobile display issues—and gives you a practical score with the fixes that matter most.
Once you know your baseline, set a goal based on the next benchmark up.
How we measured these conversion rates
The figures in this report come from an anonymized, aggregated look at more than 13,000 pages published with Leadpages, as of 2026‑11‑16. We calculated median conversion rates by industry (as self‑selected by the page owner) and by page type (landing page, sales page, squeeze page, product page, webinar registration page). We also split the data into percentiles to show the spread: the bottom quarter (below 4.66%), the top quarter (above 39%), and the top tenth (above 62.4%). Every page counted its own conversions and visitors; no outside data or surveys were used.
If you want to see how your page stacks up against this set, score your landing page with our free tool. It points you to the fixes that nudge your conversion rate into the next quarter.