
Landing page benchmarks
Phone Number Field Conversion Rate: What the Data Shows
See real data on how adding a phone number field affects form conversion rates. Median rates, top quarter benchmarks, and tips to improve your lead gen forms.
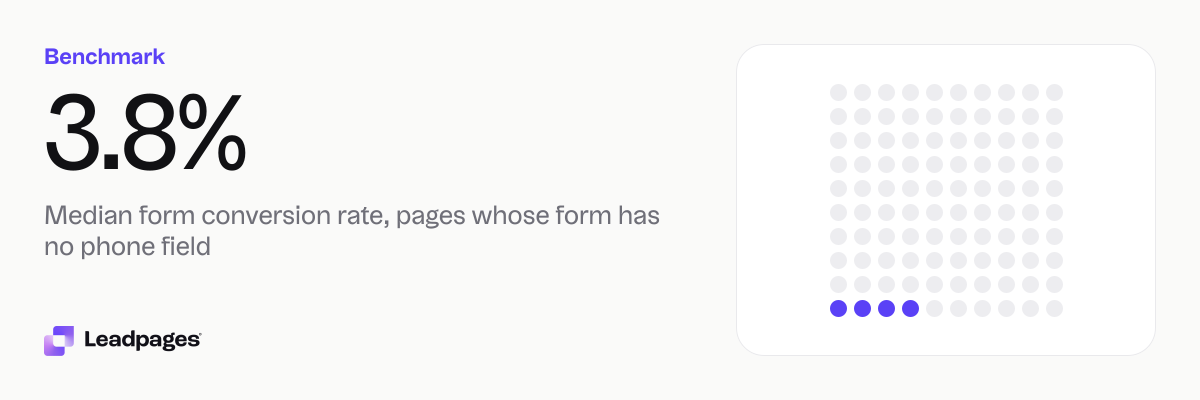
Forms that ask for a phone number usually convert less than forms that skip it. Across pages published with Leadpages, the median conversion rate for forms without a phone field is 3.8%. With a phone number field, the median is 1.81%. If you’re unsure whether to include it, the difference is worth a closer look.
Leadpages data
Form conversion rates for pages published with Leadpages, with and without a phone number field, over the 90 days to 2026-11-16. A form conversion rate is the share of visits to a page in which the visitor submitted its form. Each figure is a median or quartile across pages. It describes the pages in a group, not what causes the difference between groups.
more than 5,700 published pagesAs of November 17, 2026
3.8%
Median form conversion rate, pages whose form has no phone field
0.2%
Bottom quarter converts below, pages whose form has no phone field
25.9%
Top quarter converts above, pages whose form has no phone field
| Measure | Value |
|---|---|
| Median form conversion rate, pages whose form has no phone field | 3.8% |
| Bottom quarter converts below, pages whose form has no phone field | 0.2% |
| Top quarter converts above, pages whose form has no phone field | 25.9% |
| Top tenth converts above, pages whose form has no phone field | 47.2% |
| Median form conversion rate, pages whose form asks for a phone number | 1.81% |
| Bottom quarter converts below, pages whose form asks for a phone number | 0.47% |
| Top quarter converts above, pages whose form asks for a phone number | 4.5% |
| Top tenth converts above, pages whose form asks for a phone number | 13.8% |
| Median form conversion rate, pages with a 1-field form | 0.51% |
| Median form conversion rate, pages with a 2-field form | 7.43% |
| Median form conversion rate, pages with a 3-field form | 4.58% |
| Median form conversion rate, pages with a 4 to 5 field form | 1.54% |
| Median form conversion rate, pages with a form of 6 or more fields | 1.9% |
| Median form conversion rate, all pages | 1.96% |
Median form conversion rate, pages whose form has no phone field
Bottom quarter converts below, pages whose form has no phone field
Top quarter converts above, pages whose form has no phone field
Top tenth converts above, pages whose form has no phone field
Median form conversion rate, pages whose form asks for a phone number
Bottom quarter converts below, pages whose form asks for a phone number
Top quarter converts above, pages whose form asks for a phone number
Top tenth converts above, pages whose form asks for a phone number
Median form conversion rate, pages with a 1-field form
Median form conversion rate, pages with a 2-field form
Median form conversion rate, pages with a 3-field form
Median form conversion rate, pages with a 4 to 5 field form
Median form conversion rate, pages with a form of 6 or more fields
Median form conversion rate, all pages
Based on more than 5,700 published pages. As of November 17, 2026.
The Short Answer on Phone Number Fields and Conversion
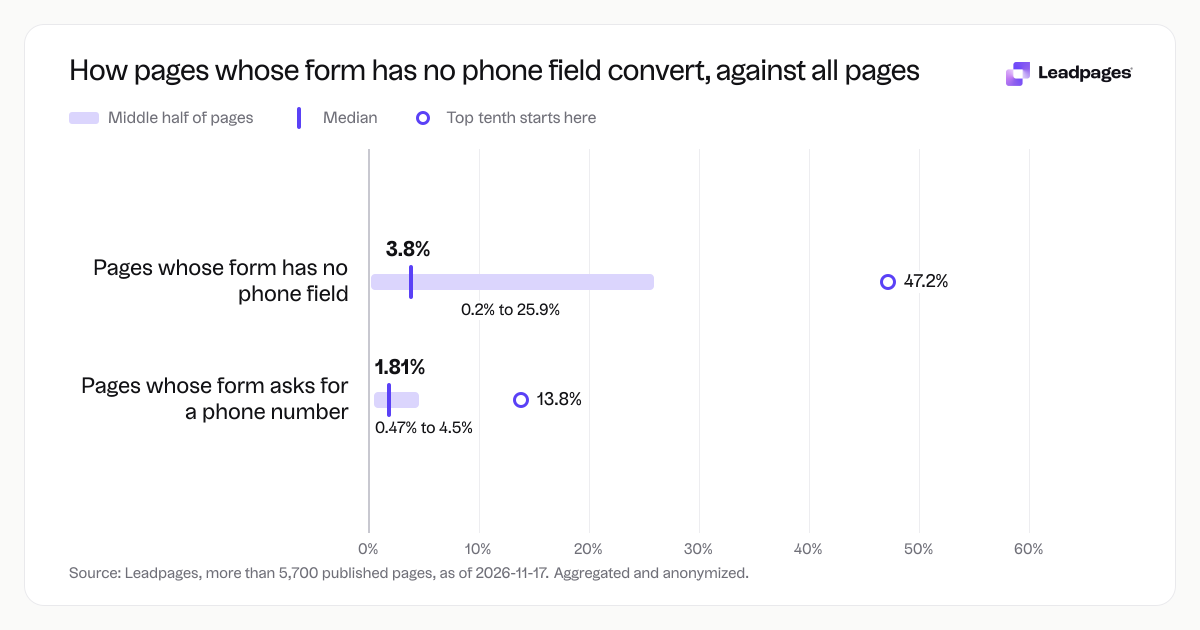
Across more than 5,700 landing pages, forms without a phone field convert at a higher median rate than forms that request a phone number. Pages with no phone field see a 3.8% median. Pages that ask for a phone number see 1.81%.
That doesn’t mean every page with a phone field struggles. The spread is wide, and many pages with a phone field still perform well. You’re adding friction, but a strong offer, clear copy, and a tight form can offset it.
How the Conversion Rates Break Down by Phone Field
To see the impact, look past the median. Here’s how the numbers spread across the dataset.
Forms without a phone number field
- Median conversion rate: 3.8%
- Bottom quarter converts below: 0.2%
- Top quarter converts above: 25.9%
- Top tenth converts above: 47.2%
Forms that ask for a phone number
- Median conversion rate: 1.81%
- Bottom quarter converts below: 0.47%
- Top quarter converts above: 4.5%
- Top tenth converts above: 13.8%
The gap is widest at the top end. The top tenth without a phone field converts nearly half of visits. With a phone field, the top tenth reaches 13.8%. That’s still solid—it shows a phone field doesn’t doom conversions. Some pages make it work.
How field count plays into the picture
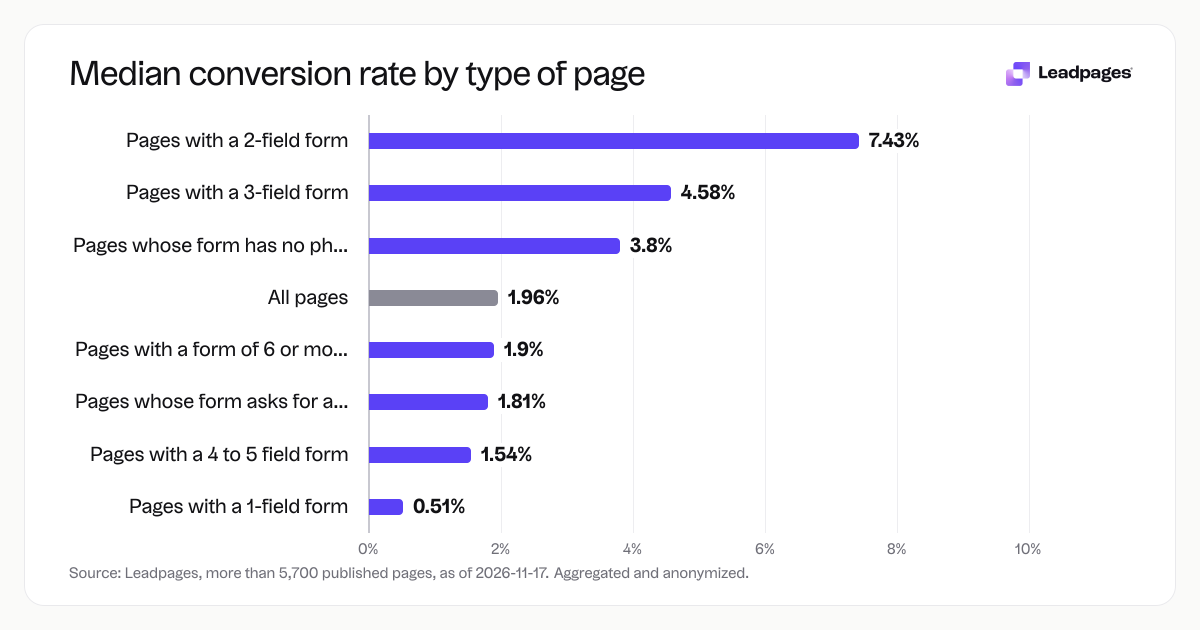
A phone field is also one more field. Across all pages, the median shifts with total field count. (These medians include all forms, whether or not they have a phone field.)
| Number of fields | Median conversion rate |
|---|---|
| 1 field | 0.51% |
| 2 fields | 7.43% |
| 3 fields | 4.58% |
| 4 to 5 fields | 1.54% |
| 6 or more fields | 1.9% |
The pattern isn’t linear. One-field forms often underperform because they collect only an email with little context, while two fields often hit a sweet spot. The takeaway: every extra field is another decision point. A phone field can push you into a higher field count, which often drags the median down. For the full view on field count, see the form fields benchmark.
What the Top Quarter of Phone-Number Forms Gets Right
Pages in the top quarter of the phone-number group convert above 4.5%. That beats the overall median across all pages (1.96%) and even edges past the median of phone-free forms. What sets them apart?
We can’t name a single cause—the data describes pages; it doesn’t explain why. But these pages likely do a few things well:
- The offer earns the extra ask. Demos, consults, or high-value content justify giving a number. A generic content upgrade rarely does.
- The rest of the form stays short. Keep other fields to a minimum. Field count data shows a 2‑ or 3‑field form often beats a longer one.
- The reason is explicit. Microcopy like “We’ll text your results” or “So we can save your spot” reduces hesitation.
- They test, then test again. Run an A/B test: one variant with the phone field, one without. Measure qualified leads, not just submissions. Use the A/B test calculator to check significance.
Small changes add up. Tighten your headline with the free headline analyzer and reduce visual clutter to lift results.
How to Measure Your Own Phone Number Field Conversion Rate
Track one number: the share of visits that end with a form submission. If you use Leadpages, your analytics dashboard shows this per page. If not, Leadpages analytics gives you that view out of the box.
Then compare your rate to these benchmarks.
- If your form doesn’t include a phone field: Above 25.9% puts you in the top quarter. Below 0.2% signals something bigger than form friction.
- If your form includes a phone field: Above 4.5% is strong. At 13.8% you’re in the top tenth. Below 0.47% suggests you’re losing visitors before they consider the form.
Context matters. Traffic source, industry, and offer shift what “good” means. The median for all pages is 1.96%. Treat it as a gut check, not a goal. Your own baseline is the better guide.
How We Measured These Phone Number Field Conversion Rates
The numbers come from an analysis of more than 5,700 pages published with Leadpages, aggregated and anonymized. The data covers a 90‑day window ending November 16, 2026.
For each page, we calculated the form conversion rate as the percentage of visits in which the visitor submitted the page’s form. We grouped pages by whether the form contained a phone number field, then computed the median and quartile rates for each group. The field‑count medians come from the same dataset, looking at all forms regardless of fields.
These figures describe pages in the sample. They’re not a causal claim that a phone number field alone lowers conversions; they show what we observe when the field is present versus when it’s not.
See how your own page stacks up in seconds. Score your landing page for quick, practical suggestions to lift your conversion rate—whether or not you keep the phone field.