
Landing page benchmarks
ChatGPT Traffic Conversion Rate: What Landing Page Data Shows
ChatGPT traffic conversion rate benchmarks by source. See medians and top quarter data from 5,700+ Leadpages pages.
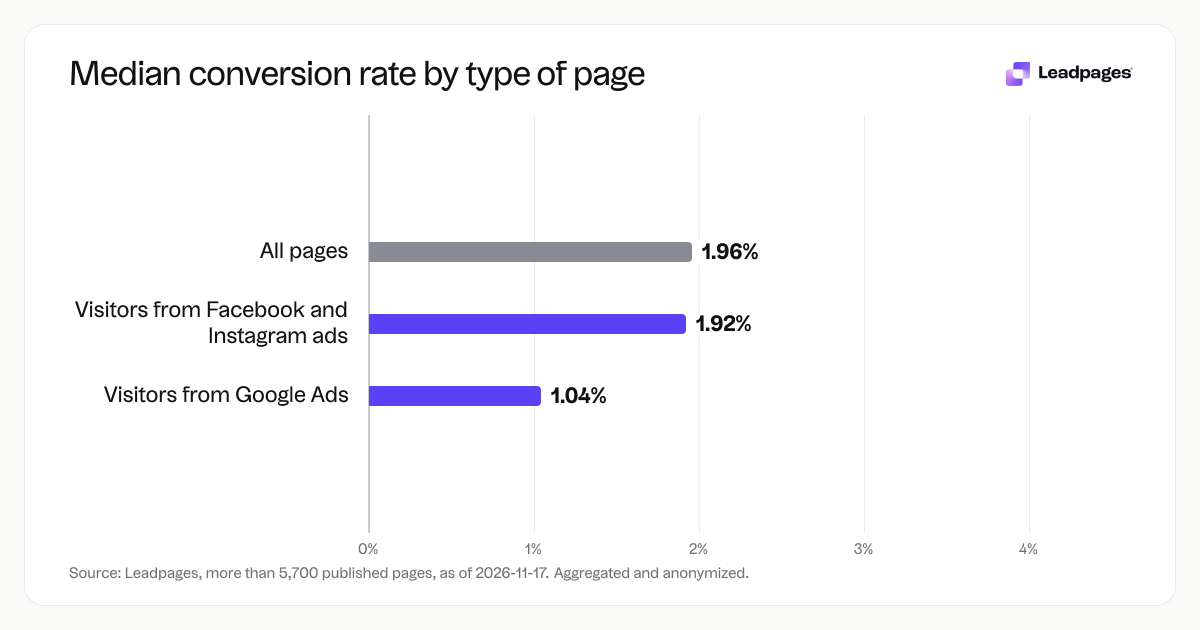
Before you benchmark ChatGPT traffic, note this: our dataset does not break out ChatGPT as its own source. The numbers below come from form conversion rates on pages published with Leadpages, grouped by where the visitor came from. The median across all pages was 1.96%.
Leadpages data
Form conversion rates for pages published with Leadpages, by where the visitor came from, over the 90 days to 2026-11-16. A form conversion rate is the share of visits to a page in which the visitor submitted its form. Each figure is a median or quartile across pages. It describes the pages in a group, not what causes the difference between groups.
more than 5,700 published pagesAs of November 17, 2026
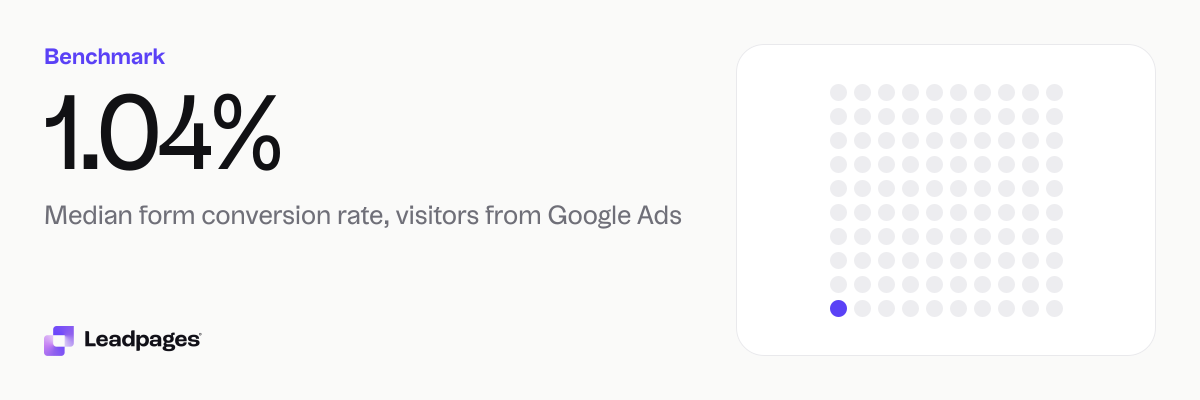
1.04%
Median form conversion rate, visitors from Google Ads
0%
Bottom quarter converts below, visitors from Google Ads
3.73%
Top quarter converts above, visitors from Google Ads
| Measure | Value |
|---|---|
| Median form conversion rate, visitors from Google Ads | 1.04% |
| Bottom quarter converts below, visitors from Google Ads | 0% |
| Top quarter converts above, visitors from Google Ads | 3.73% |
| Top tenth converts above, visitors from Google Ads | 7.47% |
| Median form conversion rate, visitors from Facebook and Instagram ads | 1.92% |
| Bottom quarter converts below, visitors from Facebook and Instagram ads | 0.09% |
| Top quarter converts above, visitors from Facebook and Instagram ads | 9.42% |
| Top tenth converts above, visitors from Facebook and Instagram ads | 22.4% |
| Median form conversion rate, all pages | 1.96% |
Median form conversion rate, visitors from Google Ads
Bottom quarter converts below, visitors from Google Ads
Top quarter converts above, visitors from Google Ads
Top tenth converts above, visitors from Google Ads
Median form conversion rate, visitors from Facebook and Instagram ads
Bottom quarter converts below, visitors from Facebook and Instagram ads
Top quarter converts above, visitors from Facebook and Instagram ads
Top tenth converts above, visitors from Facebook and Instagram ads
Median form conversion rate, all pages
Based on more than 5,700 published pages. As of November 17, 2026.
The short answer on ChatGPT traffic conversion
ChatGPT traffic is not tracked separately here, so there is no single ChatGPT conversion rate. The nearest reference points are the paid sources we do measure. For visitors from Google Ads, the median form conversion rate was 1.04%. For visitors from Facebook and Instagram ads, the median was 1.92%. If you get clicks from a ChatGPT answer, treat them like referral traffic with mixed intent. Use the all pages median of 1.96% as a starting point, then compare your own number as you collect data. If you already see ChatGPT traffic, set up a segment in your analytics and track it on its own.
How conversion rates break down by traffic source
Across pages published with Leadpages over the 90 days to 16 November 2026, form conversion rates varied by source. A form conversion rate is the share of visits where the visitor submitted the page's form.
Google Ads traffic
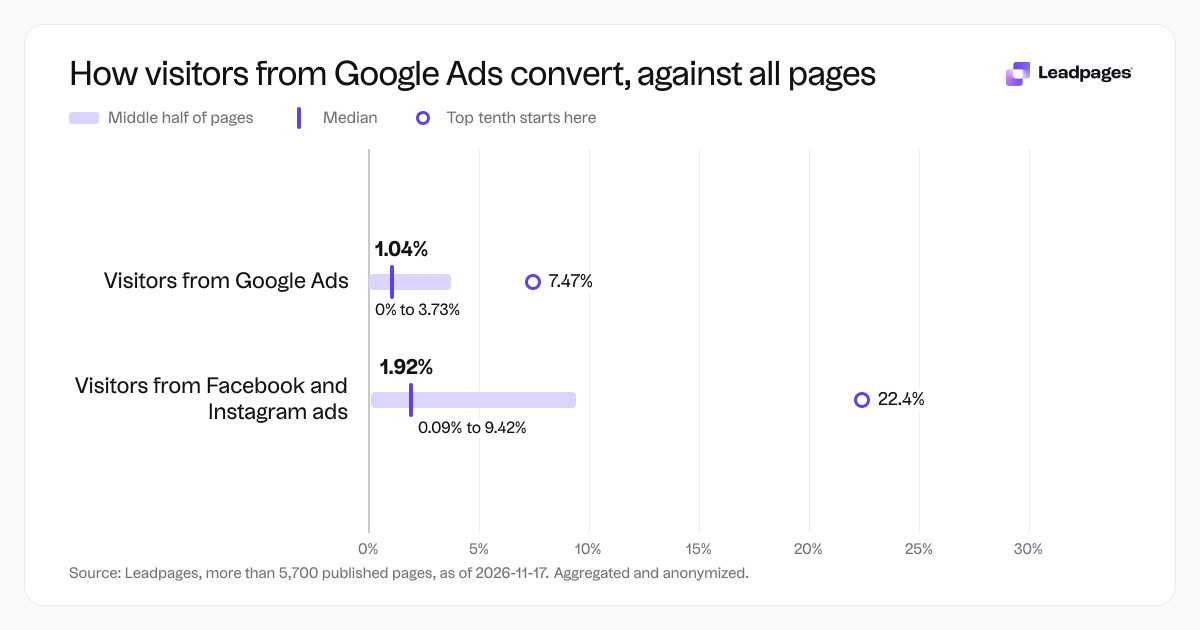
The median form conversion rate for visitors from Google Ads was 1.04%. The bottom quarter of pages converted at 0%. The top quarter converted above 3.73%. The top tenth converted above 7.47%.
That spread matters. A local plumber sending Google Ads clicks to a quote form might see one submission per 100 visits at the median. A page in the top tenth would see far more. The difference comes from the offer, the page, and how well the ad message carries through.
Facebook and Instagram ads traffic
The median form conversion rate for visitors from Facebook and Instagram ads was 1.92%. The bottom quarter converted below 0.09%. The top quarter converted above 9.42%. The top tenth converted above 22.4%.
This spread is wider than the Google Ads spread. A fitness coach promoting a free class registration on Instagram could see far fewer signups per visit at the median than at the top tenth. The page and the creative both contribute.
All pages
Across all pages, the median form conversion rate was 1.96%. That figure mixes many traffic sources, offers, and industries. It works as a general reference, but your own number makes more sense when you compare it to the source that sends you traffic. If your page receives traffic from ChatGPT, you can start with the all pages median while you collect your own data. After you have a few hundred ChatGPT visits, compare that segment to the nearest paid source benchmark.
What the top quarter numbers mean
This dataset does not measure page elements, so we cannot say which change moved a page into the top quarter. The gap itself is the signal. Pages in the top quarter for Facebook and Instagram ads convert above 9.42%, while the bottom quarter converts below 0.09%. That is a wide range.
Patterns on higher converting pages include a specific offer, a headline that matches the ad, and a form that asks only for what the business needs. For example, a software company running Google Ads to a demo request page should match the ad's promise in the headline. A dentist offering a new patient exam can keep the form to name, phone, and preferred time. Test those elements one at a time.
Use the headline analyzer to check your headline against proven patterns. Use the CTA generator to write a clearer button label. Then measure the result with the A/B test significance calculator.
How to read your own conversion rate
First, identify your traffic source. If you buy Google Ads, compare to the Google Ads median of 1.04% and top quarter of 3.73%. If you run Facebook or Instagram ads, compare to the 1.92% median and 9.42% top quarter. If you get mixed traffic, use the all pages median of 1.96%.
Next, check your sample size. A page with 50 visits and 2 conversions gives a less stable estimate than one with 500 visits and 20 conversions. Use the A/B test significance calculator to see if a difference is real before you change a page.
Then review the offer. A free quote form will convert differently than a paid product signup. Do not compare your paid product page to a lead magnet benchmark. For example, a real estate agent collecting seller leads from Google Ads should compare to other lead capture pages, not to ecommerce checkout pages.
Finally, run your page through the landing page analyzer. It gives a score and a list of practical fixes. Test one change at a time, wait for enough visits, and compare again.
How we measured this
These figures come from form conversion rates for pages published with Leadpages, grouped by where the visitor came from, over the 90 days to 16 November 2026. A form conversion rate is the share of visits to a page in which the visitor submitted its form. Each figure is a median or quartile across pages. It describes the pages in a group, not what causes the difference between groups.
Sample: more than 5,700 published pages. Aggregated and anonymized; as of 17 November 2026. The data covers Google Ads and Facebook and Instagram ads as paid sources. ChatGPT traffic is not a separate group in this dataset.
Because the figures are medians and quartiles, they show the middle and spread. They do not predict what your page will do. Use them as reference points, not targets or guarantees.
To see where your own landing page stands, run it through the landing page analyzer. It gives you a score and practical checks you can use today.