
Landing page benchmarks
Custom Domain Conversion Rate: What the Data Shows
See Leadpages data on custom domain conversion rate. Median, top quarter and top tenth benchmarks from more than 5,700 pages.
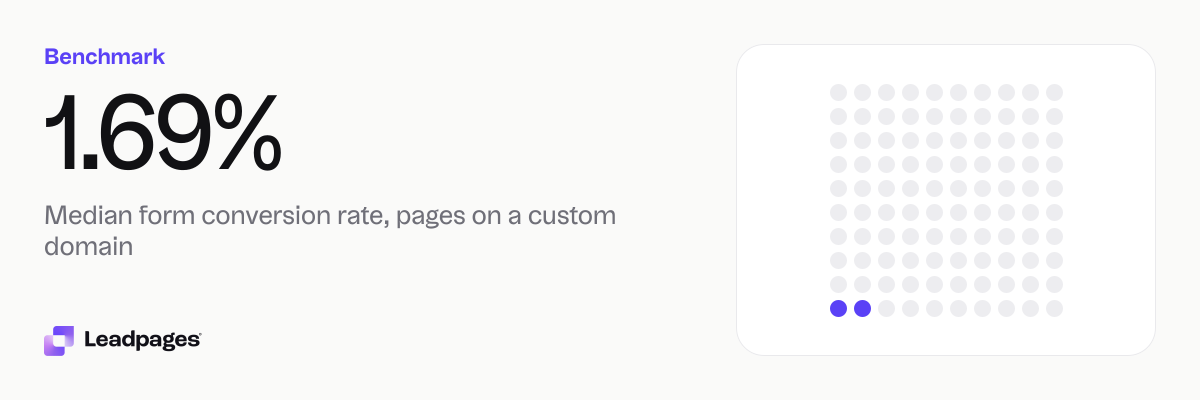
Across pages published with Leadpages, the median form conversion rate for pages on a custom domain is 1.69%. Half of custom domain pages convert below 1.69% and half convert above it. The top quarter convert above 8.61%.
Leadpages data
Form conversion rates for pages published with Leadpages, on a custom domain and on a hosted address, over the 90 days to 2026-11-16. A form conversion rate is the share of visits to a page in which the visitor submitted its form. Each figure is a median or quartile across pages. It describes the pages in a group, not what causes the difference between groups.
more than 5,700 published pagesAs of November 17, 2026
1.69%
Median form conversion rate, pages on a custom domain
0%
Bottom quarter converts below, pages on a custom domain
8.61%
Top quarter converts above, pages on a custom domain
| Measure | Value |
|---|---|
| Median form conversion rate, pages on a custom domain | 1.69% |
| Bottom quarter converts below, pages on a custom domain | 0% |
| Top quarter converts above, pages on a custom domain | 8.61% |
| Top tenth converts above, pages on a custom domain | 28.4% |
| Median form conversion rate, pages on a hosted address | 2.48% |
| Bottom quarter converts below, pages on a hosted address | 0.33% |
| Top quarter converts above, pages on a hosted address | 16.8% |
| Top tenth converts above, pages on a hosted address | 43.2% |
| Median form conversion rate, all pages | 1.96% |
Median form conversion rate, pages on a custom domain
Bottom quarter converts below, pages on a custom domain
Top quarter converts above, pages on a custom domain
Top tenth converts above, pages on a custom domain
Median form conversion rate, pages on a hosted address
Bottom quarter converts below, pages on a hosted address
Top quarter converts above, pages on a hosted address
Top tenth converts above, pages on a hosted address
Median form conversion rate, all pages
Based on more than 5,700 published pages. As of November 17, 2026.
Custom domain conversion rate: the short answer
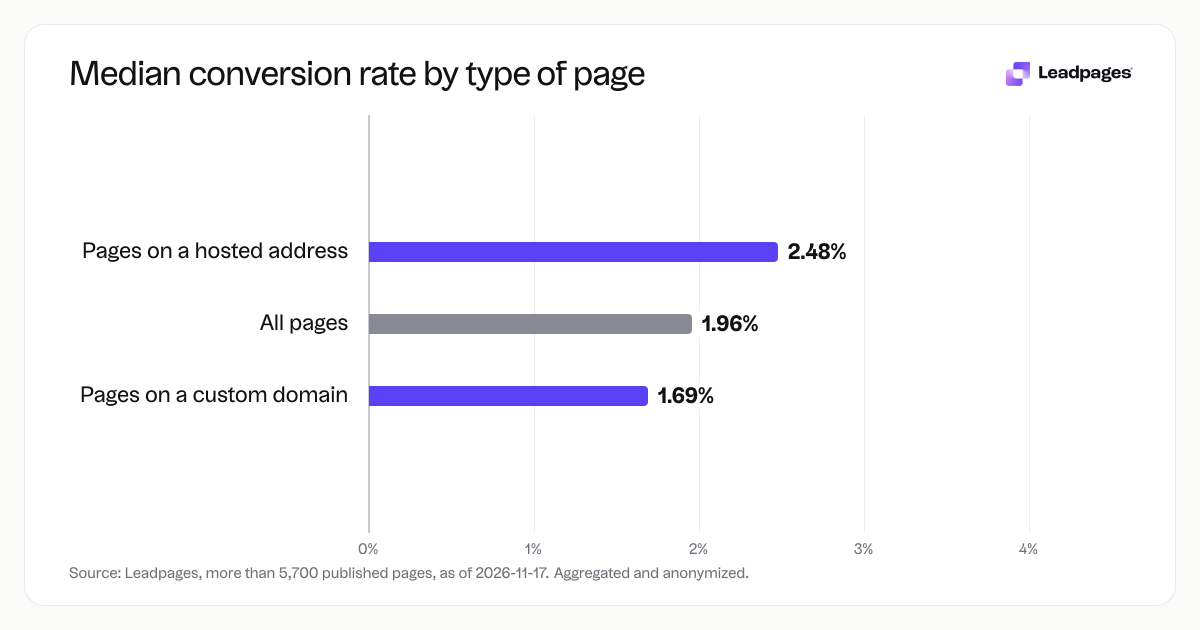
A custom domain conversion rate is the share of visits to a page on your own domain in which a visitor submits the form. In Leadpages data, the median rate for custom domain pages is 1.69%. If your page converts above 8.61%, it sits in the top quarter of custom domain pages in this sample.
For context, the median across all pages in the sample is 1.96%. Pages on a hosted address have a median form conversion rate of 2.48%. The difference is descriptive, not a score for your domain choice. It shows where a page sits compared with other pages published through Leadpages over the same period.
Start by watching your own number. Benchmarks set expectations. They do not replace test results from your visitors.
How the custom domain numbers break down
The table below shows the thresholds for custom domain pages and hosted address pages.
| Group | Bottom quarter below | Median | Top quarter above | Top tenth above |
|---|---|---|---|---|
| Custom domain pages | 0% | 1.69% | 8.61% | 28.4% |
| Hosted address pages | 0.33% | 2.48% | 16.8% | 43.2% |
The median for all pages in the sample is 1.96%.
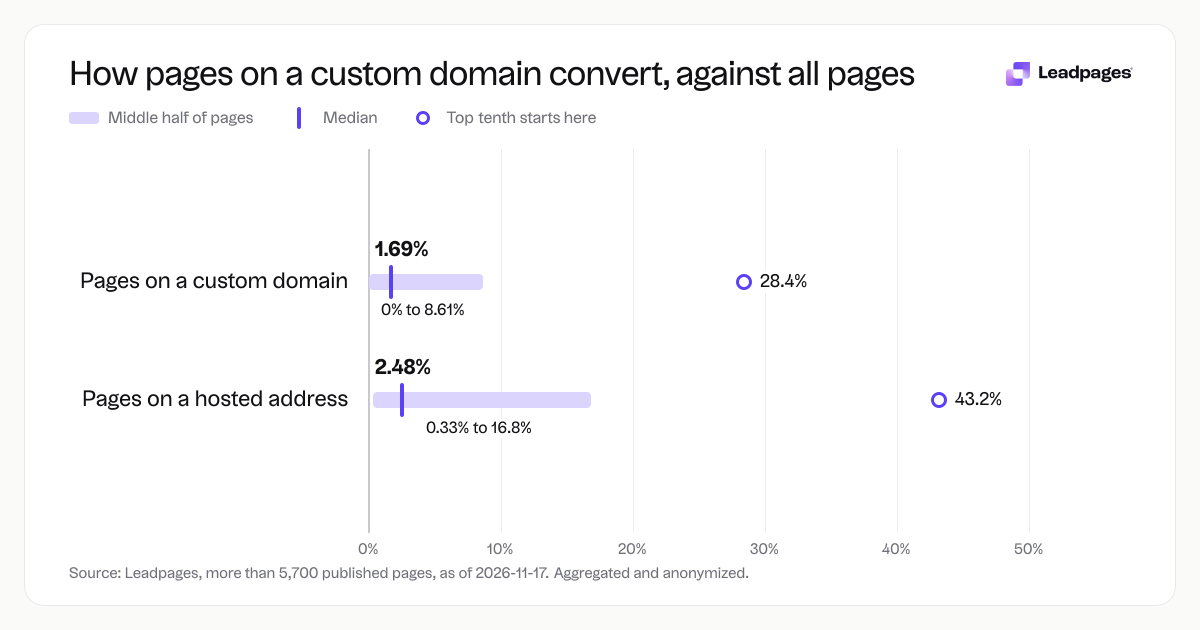
Read the table as thresholds. For custom domain pages, half convert below 1.69% and half convert above it. The bottom quarter convert below 0%, which means a meaningful group of pages received visits but no form submissions during the measurement period. The top quarter convert above 8.61%, and the top tenth convert above 28.4%.
Hosted address pages show higher thresholds in this sample. The median is 2.48%. The top quarter start at 16.8%, and the top tenth start at 43.2%. That does not mean a hosted address causes higher conversion. The data describes the pages, not the reason behind the difference.
When you compare your own page, use the group that matches your setup. A custom domain page should be compared with the custom domain row, not the all-pages median.
What top-quarter custom domain pages do differently
The data does not tell us which choices moved a page into the top quarter. It gives you the boundary, not the recipe. Still, you can use the 8.61% threshold as a reference for your own tests.
Start by checking the basics. A visitor should see one clear offer, one form and a reason to act within a few seconds. If the page has competing links or a long form before the value is clear, test a simpler version. Use the free landing page analyzer to find weak spots in structure, readability and call to action. Run a headline test before you change a page headline.
Change one element at a time. For example, a free quote page for a roofing company might test a headline that names the local area against one that names the response time. Use the A/B test calculator to check whether a difference is real before you keep it. If you build pages in Leadpages, you can set up the test with A/B testing.
The goal is to move your own number to a level you can trust. Keep records of each test so you learn what works for your offer. A page that asks for a name and email may convert differently from a page that asks for a phone number and postcode. Test the form fields too. Use a call-to-action generator if you need a specific next step for the button.
How to read your own custom domain figure
Calculate your custom domain conversion rate the same way we did. Take the number of form submissions on a page and divide it by the number of visits to that page over the same period. If you use Leadpages, you can see this in Leadpages analytics.
Compare your number to the median first. If you are above 1.69%, you are in the top half of custom domain pages in this sample. If you are above 8.61%, you are in the top quarter. Those comparisons help, but they are not the whole story.
A low rate may be a page problem or an offer problem. A page for a free 20-minute consultation may convert differently from a page that asks for a deposit. Look at where visitors came from too. Paid traffic from a specific ad often behaves differently from organic traffic. The data cannot tell you which factor matters most for your page.
Focus on direction, not a single snapshot. Track the same page over a few weeks. If you change a headline and your rate moves from below the median to above it, that is a useful signal. Then test the next element.
One more practical point: make sure your page and form tracking work correctly. A rate of 0% is the bottom-quarter threshold in this sample, but it is also what you will see if a form is not connected or a thank-you page is not firing. Submit a real test lead yourself before you read too much into the number.
How we measured these conversion rates
These figures come from Leadpages data. We looked at form conversion rates for pages published with Leadpages, on a custom domain and on a hosted address, over the 90 days to 2026-11-16. A form conversion rate is the share of visits to a page in which the visitor submitted its form.
Each figure is a median or quartile across pages. It describes the pages in a group, not what causes the difference between groups. The sample includes more than 5,700 published pages. The data is aggregated and anonymized, as of 2026-11-17.
We did not look at individual visitors or individual businesses. The sample is a snapshot of pages that were live during the period. Use these benchmarks as a comparison point, not as a guaranteed outcome for any page.
Next step: open the free landing page analyzer, enter your page URL and compare your score with the custom domain figures above. That gives you a practical starting point for improvement.