
Landing page benchmarks
Conversion Rate by Traffic Source: What Landing Page Data Shows
See median conversion rates by traffic source for paid search, organic social, email, and other channels, from 5,700+ Leadpages landing pages.
Conversion rate by traffic source is not one number. Across more than 5,700 landing pages built with Leadpages, the median form conversion rate for all traffic was 1.96%. That headline figure covers a wide range: organic social visitors converted at a median of 8.3%, while organic search visitors converted at 0.89%. Knowing where your visitors come from helps you set expectations and choose which channels to work on first.
Leadpages data
Form conversion rates for pages published with Leadpages, by traffic channel, over the 90 days to 2026-11-16. A form conversion rate is the share of visits to a page in which the visitor submitted its form. Each figure is a median or quartile across pages. It describes the pages in a group, not what causes the difference between groups.
more than 5,700 published pagesAs of November 17, 2026
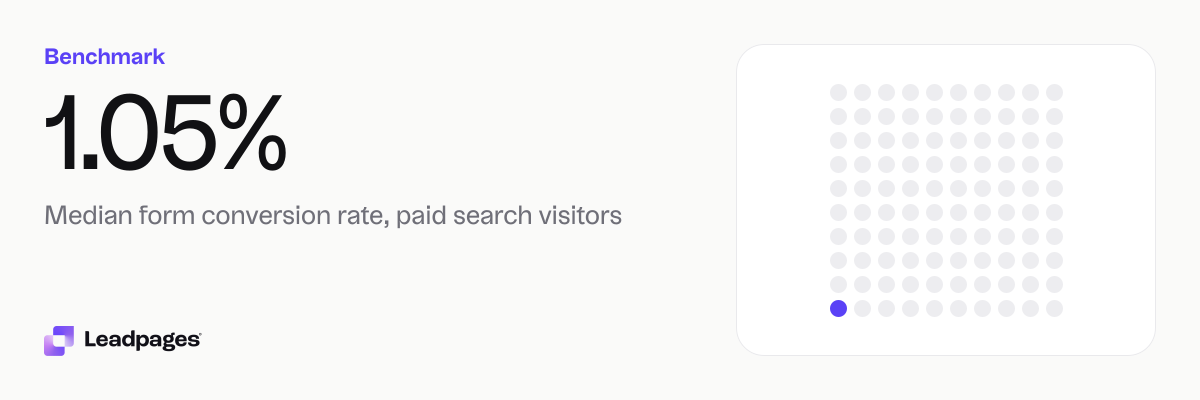
1.05%
Median form conversion rate, paid search visitors
1.93%
Median form conversion rate, paid social visitors
0.89%
Median form conversion rate, organic search visitors
| Measure | Value |
|---|---|
| Median form conversion rate, paid search visitors | 1.05% |
| Median form conversion rate, paid social visitors | 1.93% |
| Median form conversion rate, organic search visitors | 0.89% |
| Median form conversion rate, organic social visitors | 8.3% |
| Median form conversion rate, email visitors | 2.27% |
| Median form conversion rate, referral visitors | 2.04% |
| Median form conversion rate, direct visitors | 1.14% |
| Median form conversion rate, pages on a custom domain | 1.69% |
| Median form conversion rate, pages on a hosted address | 2.48% |
| Median form conversion rate, pages that load in 1 to 2.5 seconds | 2.76% |
| Median form conversion rate, pages that load in 2.5 to 4 seconds | 1.91% |
| Median form conversion rate, pages that take over 4 seconds to load | 0.88% |
| Median form conversion rate, all pages | 1.96% |
Median form conversion rate, paid search visitors
Median form conversion rate, paid social visitors
Median form conversion rate, organic search visitors
Median form conversion rate, organic social visitors
Median form conversion rate, email visitors
Median form conversion rate, referral visitors
Median form conversion rate, direct visitors
Median form conversion rate, pages on a custom domain
Median form conversion rate, pages on a hosted address
Median form conversion rate, pages that load in 1 to 2.5 seconds
Median form conversion rate, pages that load in 2.5 to 4 seconds
Median form conversion rate, pages that take over 4 seconds to load
Median form conversion rate, all pages
Based on more than 5,700 published pages. As of November 17, 2026.
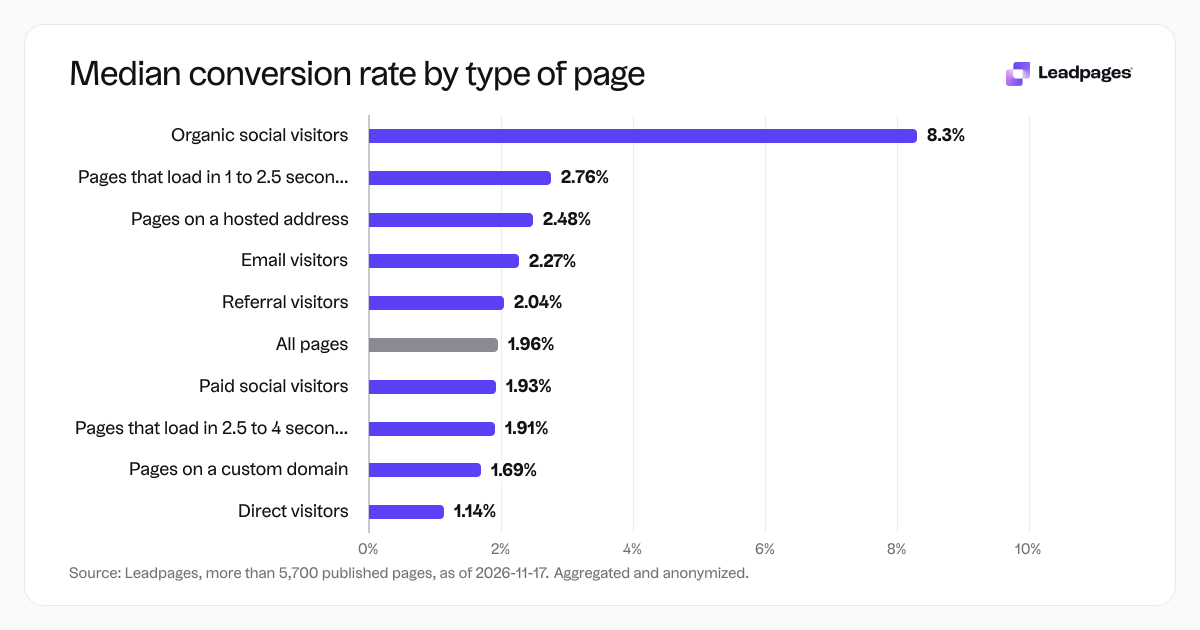
What typical conversion rates look like by traffic source
The numbers below are medians. Half the pages in each group saw a higher form conversion rate, and half saw a lower one. Use them as a reference, not a target.
Median form conversion rate by traffic source
- Paid search: 1.05%
- Paid social: 1.93%
- Organic search: 0.89%
- Organic social: 8.3%
- Email: 2.27%
- Referral: 2.04%
- Direct: 1.14%
The overall median, counting all visits together, was 1.96%. It sits between the lowest and highest channel rates because some channels send more traffic than others.
How each traffic source stacks up
Paid search: 1.05%
Visitors who clicked a paid search ad submitted the form at a median rate of 1.05%. These people already showed intent by searching a term, so a well-matched landing page can push that rate higher. If your paid search rate is near the median, tighten how your page copy matches the ad promise.
Paid social: 1.93%
People arriving from ads on platforms like Facebook, Instagram or LinkedIn converted at a median of 1.93%. Paid social often interrupts browsing, and the visitor may not have searched for your offer. Pages that show value fast and remove friction tend to land above this median.
Organic search: 0.89%
Visitors from unpaid search results had the lowest median conversion rate of the group. This is common. Someone reading a blog post or a general guide may click with curiosity, not buying intent. If organic search is your main channel, match the page content to the exact query and make the next step obvious.
Organic social: 8.3%
Organic social visitors converted at a median of 8.3%, higher than any other channel. These people usually follow your brand already. They arrive from a post, story or bio link with context the page does not need to rebuild. For a small business with an engaged social audience, this channel often delivers the highest conversion rate among all sources.
Email: 2.27%
Email traffic converted at a median of 2.27%. Subscribers already know you and have opened a message you sent. A page that continues the conversation with the same offer, language and look tends to convert these visitors well.
Referral: 2.04%
Traffic from other websites (a link in an article, a partner’s page, a directory) converted at a median of 2.04%. The visitor may have been recommended to you, so trust signals and a clear link to the referring context help.
Direct: 1.14%
Direct visitors are people who typed your URL or used a bookmark. They already meant to visit your page, but the median conversion rate was 1.14%. This often includes traffic that analytics tools cannot attribute to another source, so treat this number with caution.
What pages with higher conversion rates have in common
The data cannot say why some pages convert more, but a few patterns stand out. Two factors correlated with higher median form conversion rates: page speed and the type of address.
Speed and conversion
Pages that load quickly are associated with more form submissions. The medians show a clear drop as load time increases:
- Pages that loaded in 1 to 2.5 seconds: 2.76%
- Pages that loaded in 2.5 to 4 seconds: 1.91%
- Pages that took over 4 seconds to load: 0.88%
These are group medians, not a guarantee. Still, a page that loads in under 2.5 seconds sits near the top of the range. If your page takes more than 4 seconds, even a good traffic source may deliver a below-average conversion rate.
Address type
Pages on a hosted address (for example, yourbrand.leadpages.co) had a median conversion rate of 2.48%, while pages on a custom domain (such as page.yourbrand.com) had a median of 1.69%. Hosted pages are often single-purpose pages built fast for a specific campaign. That focus may help explain the higher median.
How to compare your page to these benchmarks
Start by checking your analytics for the same traffic source breakdowns. If you use Leadpages, the analytics dashboard shows form conversion rates split by channel. Compare each channel’s rate to the medians above, and factor in your offer, audience and page design.
For example, a yoga studio running Instagram ads might compare its paid social rate to the 1.93% median. A webinar signup page promoted via an email list could aim near the 2.27% median. The numbers give context, not a single goal every page must hit.
If a channel is under the median for your page type, review a few practical points:
- Does the page match the message the visitor clicked? A mismatch between ad copy and headline is a common drag on paid search and paid social rates. Use a free headline analyzer to check that your main statement aligns with the ad or post.
- Is the page loading fast enough? The median for pages under 2.5 seconds was 2.76%, while over 4 seconds drops to 0.88%. Test your page on a mobile connection.
- Are you showing the right offer for the channel? Someone from organic social already knows your brand. A strong, direct offer often works. Someone from organic search may need more explanation before they act.
- Do you have a way to test changes? Split testing measures which version of a page converts visitors from a specific source better. A free A/B test significance calculator helps you decide if a result is reliable before you commit.
When you want a side-by-side view of your page against the benchmarks, run it through the landing page analyzer. It scores your page on conversions, copy and mobile readiness, and gives you specific actions to take.
Where these numbers come from
The figures in this post are drawn from data about pages published with Leadpages. The sample includes more than 5,700 published pages, aggregated and anonymized, during the 90 days up to November 16, 2026. A form conversion rate is the share of visits to a page in which the visitor submitted its form. Each figure is a median across pages within that group. It describes the pages in the group, not what causes the difference between groups. The data was collected and measured entirely inside Leadpages.
Compare your page to these benchmarks with the free landing page analyzer.