
Landing page benchmarks
Squeeze Page Conversion Rate: Benchmarks from 13,000+ Pages
The median squeeze page conversion rate is 34.9%. See how the top quarter converts above 55.9% and what high-performing pages do differently.
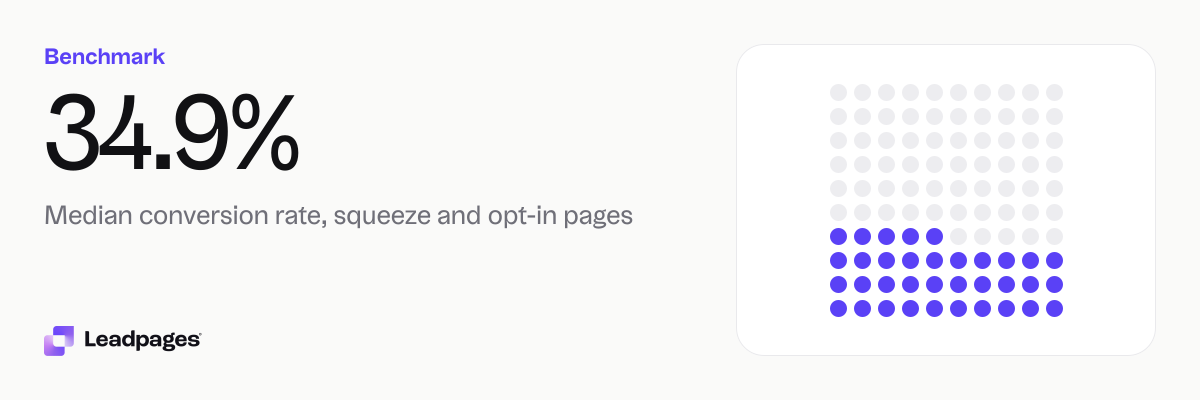
Across more than 13,000 pages published with Leadpages, the median squeeze page conversion rate is 34.9%. That means a typical squeeze page turns about one in three visitors into a lead. Squeeze pages convert more than twice as well as all landing pages combined, where the median is 15.7%.
Leadpages data
Conversion rates for squeeze and opt-in pages published with Leadpages, compared with all pages
more than 13,000 published pagesAs of November 22, 2026
34.9%
Median conversion rate, squeeze and opt-in pages
16.3%
Bottom quarter converts below, squeeze and opt-in pages
55.9%
Top quarter converts above, squeeze and opt-in pages
| Measure | Value |
|---|---|
| Median conversion rate, squeeze and opt-in pages | 34.9% |
| Bottom quarter converts below, squeeze and opt-in pages | 16.3% |
| Top quarter converts above, squeeze and opt-in pages | 55.9% |
| Top tenth converts above, squeeze and opt-in pages | 71.1% |
| Share converting at 10% or better, squeeze and opt-in pages | 83.2% |
| Median conversion rate, all pages | 15.7% |
| Bottom quarter converts below, all pages | 4.66% |
| Top quarter converts above, all pages | 39% |
| Top tenth converts above, all pages | 62.4% |
| Share converting at 10% or better, all pages | 59.9% |
Median conversion rate, squeeze and opt-in pages
Bottom quarter converts below, squeeze and opt-in pages
Top quarter converts above, squeeze and opt-in pages
Top tenth converts above, squeeze and opt-in pages
Share converting at 10% or better, squeeze and opt-in pages
Median conversion rate, all pages
Bottom quarter converts below, all pages
Top quarter converts above, all pages
Top tenth converts above, all pages
Share converting at 10% or better, all pages
Based on more than 13,000 published pages. As of November 22, 2026.
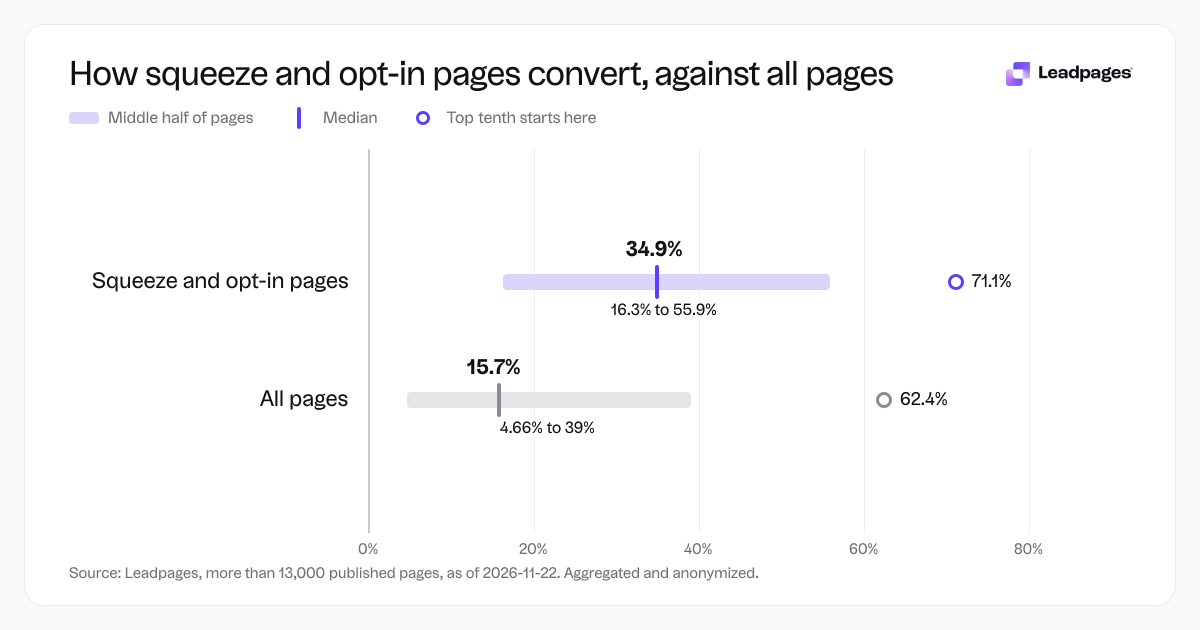
What a typical squeeze page conversion rate looks like
If you ask visitors for an email address and nothing else in exchange for a lead magnet, a 34.9% conversion rate is a solid benchmark. That is the median across all squeeze and opt-in pages we track, so half of pages convert higher and half convert lower.
Because squeeze pages ask for very little, they often beat longer forms, webinar flows, or pages that collect payment details. Across all landing page types, 59.9% reach that threshold.
These numbers are not tied to one industry or use case. They come from pages that promote checklists, ebooks, free trials, newsletter signups, and other low-barrier offers. The common thread is a single ask: an email address in return for something useful right away.
How the numbers break down
A median only shows the middle of the pack. The range is wide, and that range is where you find room to move.
For squeeze and opt-in pages:
- Median conversion rate: 34.9%
- Bottom quarter: below 16.3%
- Top quarter: above 55.9%
- Top tenth: above 71.1%
For all landing pages (including click-through pages, sales pages, and others):
- Median conversion rate: 15.7%
- Bottom quarter: below 4.66%
- Top quarter: above 39%
- Top tenth: above 62.4%
The gap between the bottom quarter and the top tenth of squeeze pages is large. Pages in the top tenth capture a much higher share of visitors. Pages in the bottom quarter leave most visitors unconverted.
Use these bands as a gauge. If your squeeze page converts below 16.3%, you are in the lowest quarter of pages we see. If you are above 55.9%, you are ahead of three quarters of similar pages. The goal is not a magic number. It is to know which direction to move and to test against your own baseline.
What the top quarter does differently
The benchmarks do not say exactly why a page lands in the top quarter. But pages that convert above 55.9% often share a few habits you can borrow.
First, the headline matches the promise. If someone clicked an ad or a social post that said "Free SEO checklist," the page headline says the same thing. No clever rephrasing, no extra steps. You can test your own headlines free with our headline analyzer.
Second, the page asks for one thing. Top-performing squeeze pages rarely ask for a name, phone number, or company size. One field (email) removes friction. If a lead magnet truly needs a phone number later, collect it after the email is confirmed.
Third, the offer solves a specific problem in the next five minutes. "Get our newsletter" rarely converts near the top quarter. "Download the 10-point audit checklist you can run today" sets a clearer expectation. You can browse our template gallery to see how layout and copy work together for offers like this.
Fourth, the page removes exit routes. Top-quarter pages often have no navigation menu, no footer links, no social icons, and no sidebar. The only clickable path is the submit button. Pages that follow this pattern keep attention on the offer.
Fifth, they include a proof element. A short testimonial, a count of downloads, or a logo from a recognizable publication all work. The proof does not need to be complex. One sentence from a real user is often enough.
Sixth, the page loads fast. While speed alone will not move you from the bottom quarter to the top, slow pages lose visitors before the headline appears. Faster pages remove that silent friction.
None of these habits is complex. The difference between a median page and a top-quarter page is often a few choices that reduce confusion and make the next step obvious.
How to read your own number
Your conversion rate is not a report card. It is a signal. A number in isolation is less useful than one compared to your own past performance and to relevant benchmarks.
Start by comparing your squeeze page to the bands above. That tells you there is headroom. That suggests a few targeted tests could push you into the top group.
Next, account for your traffic source. Visitors from an email list you have nurtured for months often convert higher than cold paid-search traffic. Our conversion rate by traffic source benchmarks give you a reference for different channels, so you set fair expectations per source rather than blending everything into one number.
Then pick one element to test. Change the headline first, since it is the first thing visitors see. Use our free A/B test calculator to know when your result is statistically reliable, not just a fluke. Small sample sizes can mislead, and the calculator helps you avoid acting on noise.
Watch the direction over time. Keep going. The top quarter did not get there in one change. They ran a sequence of tests, each informed by the last.
Finally, get an objective second look. The free landing page analyzer scores your page across copy, design, and conversion elements and gives you concrete suggestions. It takes about a minute and helps you spot issues you might have stopped seeing.
How we measured these benchmarks
The numbers come from more than 13,000 published pages. Aggregated and anonymized; as of 2026-11-22.
We define conversion as a visitor submitting a form on the page. For squeeze and opt-in pages, that almost always means providing an email address. We calculate the conversion rate as the total number of conversions divided by the total number of visitors for each page, then look at the median and the distribution across all pages.
We separate squeeze and opt-in pages from all page types because the intent is different. The all-pages group includes click-through pages, sales pages, webinar registration pages, and more, many of which ask for multiple fields or a purchase. That broader group has its own benchmarks, and you can see the contrast above.
The figures are medians, not averages. The median is the middle value when all pages are sorted by conversion rate. It is not skewed by a few pages with extremely high or low rates, so it reflects what a typical page does better than an average would.
No personal or business-identifiable information is included. The sample spans different industries, offer types, and traffic sources. Results will vary for any single page, but these bands give you a practical starting point for comparing your own squeeze page.
Score your squeeze page: Use the free landing page analyzer to see where you stand and get practical suggestions.