
Landing page benchmarks
Conversion Rate Improvement: Benchmarks from More Than 13,000 Pages
See median conversion rates by industry and page type from more than 13,000 Leadpages pages, plus what the top quarter does differently.
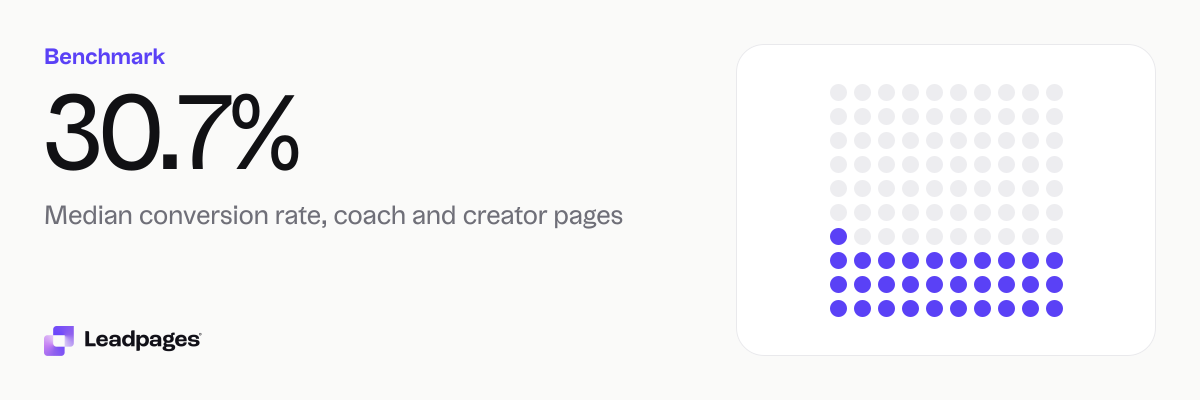
Across pages published with Leadpages, the median conversion rate is 15.7%. Half of pages beat that number and half fall below it. If your page trails the median for its industry or page type, start by comparing your rate to the right benchmark.
Leadpages data
Conversion rates for pages published with Leadpages, by industry and page type
more than 13,000 published pagesAs of November 22, 2026
30.7%
Median conversion rate, coach and creator pages
19.8%
Median conversion rate, education pages
11.2%
Median conversion rate, healthcare pages
| Measure | Value |
|---|---|
| Median conversion rate, coach and creator pages | 30.7% |
| Median conversion rate, education pages | 19.8% |
| Median conversion rate, healthcare pages | 11.2% |
| Median conversion rate, finance pages | 14.9% |
| Median conversion rate, ecommerce pages | 6.84% |
| Median conversion rate, real estate pages | 9.65% |
| Median conversion rate, local service pages | 8.22% |
| Median conversion rate, squeeze and opt-in pages | 34.9% |
| Median conversion rate, webinar registration pages | 29.2% |
| Median conversion rate, landing pages | 15.6% |
| Median conversion rate, product pages | 9.25% |
| Median conversion rate, sales pages | 6.97% |
| Median conversion rate, all pages | 15.7% |
| Bottom quarter converts below, all pages | 4.66% |
| Top quarter converts above, all pages | 39% |
| Top tenth converts above, all pages | 62.4% |
| Share converting at 10% or better, all pages | 59.9% |
Median conversion rate, coach and creator pages
Median conversion rate, education pages
Median conversion rate, healthcare pages
Median conversion rate, finance pages
Median conversion rate, ecommerce pages
Median conversion rate, real estate pages
Median conversion rate, local service pages
Median conversion rate, squeeze and opt-in pages
Median conversion rate, webinar registration pages
Median conversion rate, landing pages
Median conversion rate, product pages
Median conversion rate, sales pages
Median conversion rate, all pages
Bottom quarter converts below, all pages
Top quarter converts above, all pages
Top tenth converts above, all pages
Share converting at 10% or better, all pages
Based on more than 13,000 published pages. As of November 22, 2026.
The short answer
Conversion rate is the share of visits that complete the action you want, such as a form submission, a booked call, or a purchase. Across more than 13,000 published pages in our sample, the median is 15.7%. Since a median is the middle value, half of pages did better and half did worse.
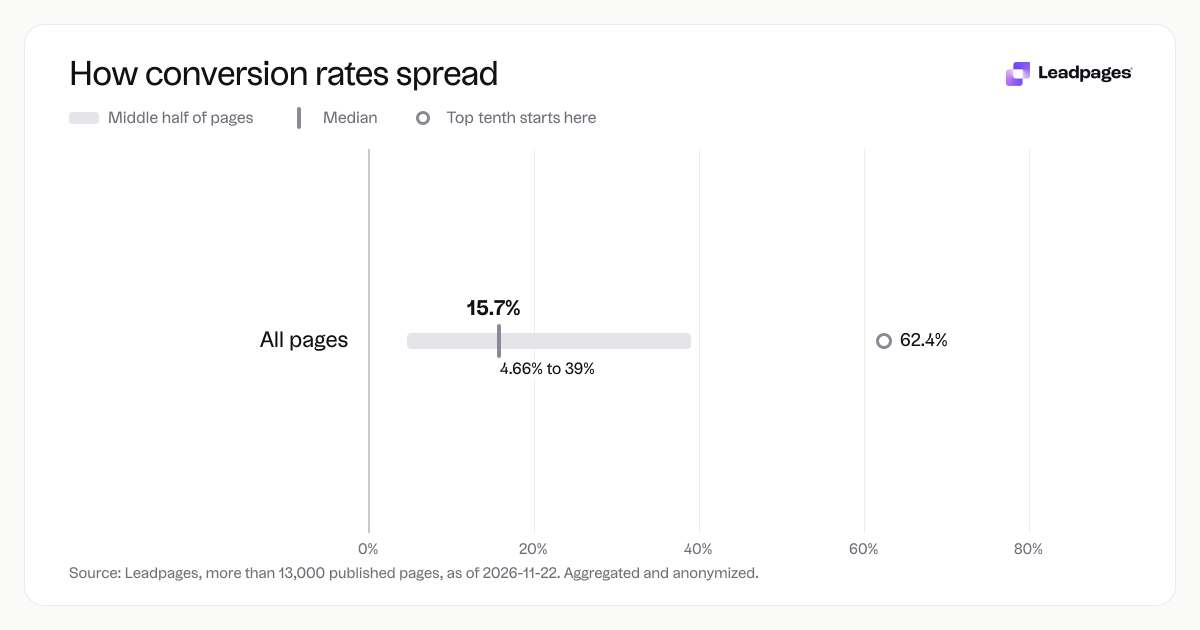
Use 15.7% as a broad reference, then check the median for your industry and page type. The spread is wide. The bottom quarter of all pages converts below 4.66%. The top quarter converts above 39%. The top tenth converts above 62.4%. This range shows there is room to improve, and it shows why you should judge your page against a similar group.
How the numbers break down
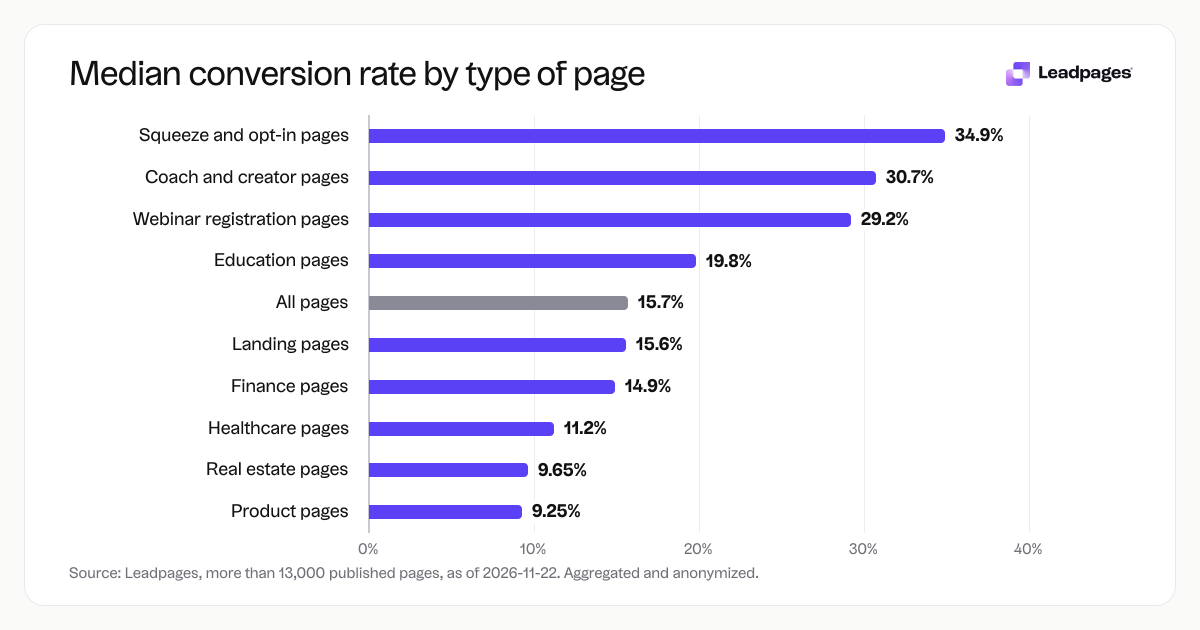
We separated the data by industry and page type. The medians show that different jobs produce different conversion rates.
By industry
- Coach and creator pages: 30.7%
- Education pages: 19.8%
- Finance pages: 14.9%
- Healthcare pages: 11.2%
- Real estate pages: 9.65%
- Local service pages: 8.22%
- Ecommerce pages: 6.84%
A coach or creator page often promotes one clear step, such as a free guide or a webinar. A local service page may ask for a phone number and a service choice, which adds friction. An ecommerce product page has to support more consideration before a purchase. The medians reflect those jobs.
By page type
- Squeeze and opt-in pages: 34.9%
- Webinar registration pages: 29.2%
- Landing pages: 15.6%
- Product pages: 9.25%
- Sales pages: 6.97%
Squeeze and opt-in pages tend to convert best because the ask is small, usually an email in exchange for one useful thing. Webinar registration pages also do well because the visitor is saying yes to a specific event. Sales pages convert lower because the visitor is being asked to spend money or make a longer decision.
What the top quarter does differently
The top quarter of all pages converts above 39%. That is a high bar. 59.9% of all pages meet or exceed the dataset's common conversion threshold. That makes a page at the threshold common, but it is still far from the top quarter. The bottom quarter converts below 4.66%.
The distance between the bottom and top quarter usually comes from a few practical choices. Stronger pages tend to match the page to the traffic source, make one offer, keep the form short, and use a clear call to action. For example, a paid search page for a local house cleaning service should repeat the keyword, show a simple quote form, and give one phone number. A page that lists five services and asks for a full address will usually work harder to convert.
To close that gap, change one thing at a time. Test a new headline, a shorter form, or a different button. Use an A/B test calculator to check that the change is real before you keep it. If the headline is the first change, run it through the free headline analyzer before you test. You can also start from a focused template built for your page type.
How to read your own number
Start with the median for your page type or industry. If you run a webinar, compare your page to the webinar registration median of 29.2%, not to the all-page median. If you run an ecommerce product page, compare it to 6.84%, not to a squeeze page.
A page below its group median has a clear signal to test. A page above its group median can still improve, but the next benchmark is the top quarter threshold of 39% for all pages, or the top tenth threshold of 62.4%. Most pages do not hit those numbers, so treat them as direction, not pass or fail.
Track conversion rate over time. A single day with few visits can mislead. Wait until the page has enough visits to make a fair comparison. If you change the page, keep the old version live for a fair test. The A/B testing tools in Leadpages let you split traffic and compare results.
Use this sequence to read your own number:
- Find the median for your page type or industry.
- Compare your current rate over a period with enough visits.
- If you are below the median, pick one element to test.
- Use an A/B test to confirm the change before rolling it out.
How we measured this
The figures on this page come from conversion rates for pages published with Leadpages, by industry and page type. The sample is more than 13,000 published pages. The data is aggregated and anonymized; as of 2026-11-22.
We use medians, not averages, because a median is less affected by a small number of unusually high or low pages. Each page's conversion rate is the number of completed actions divided by the number of visits. We grouped pages by the industry they serve and by the page type they represent.
The fastest next step is to score your landing page with the free analyzer. It checks the parts of a landing page that affect conversion and shows where to focus your next test.