
Landing page benchmarks
Google Ads landing page conversion rate benchmarks
See how your Google Ads landing page conversion rate compares. Real benchmarks for paid search, plus what the top pages do and a free tool to score your page.
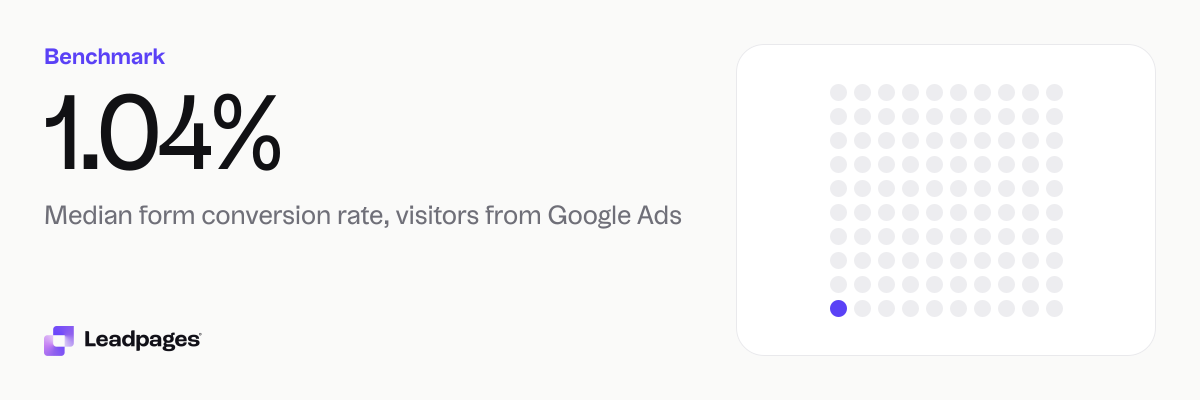
The median Google Ads landing page published with Leadpages converts at 1.04%. Half the pages that get visitors from Google Ads convert above that number, and half convert below. It is a tight range across traffic sources and a useful benchmark if you run paid search.
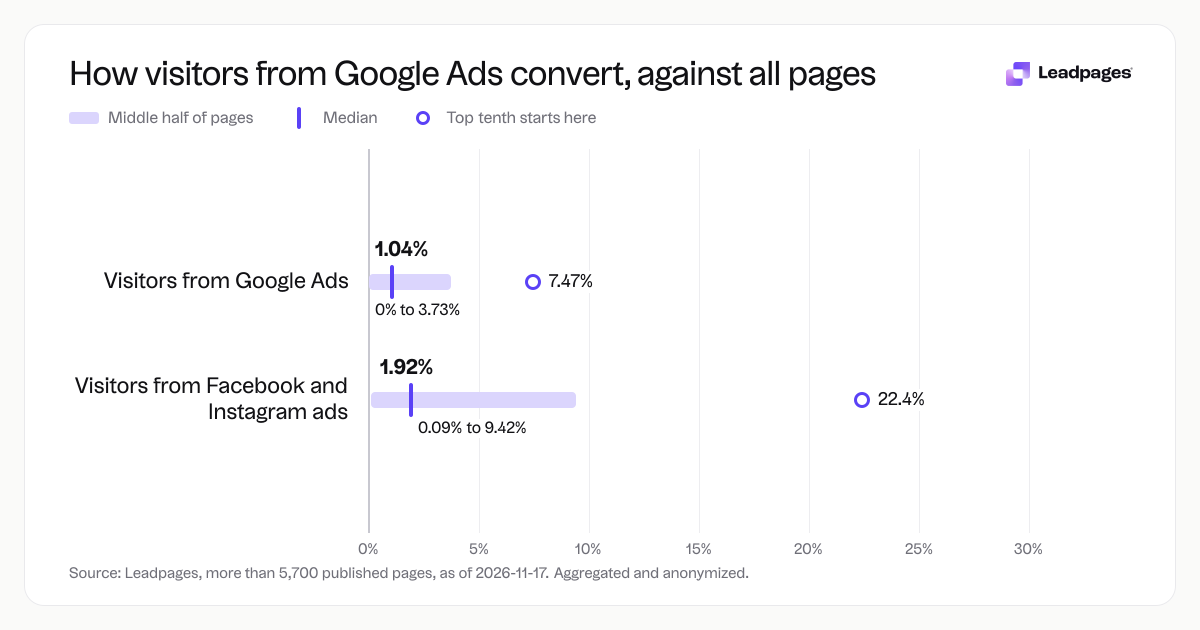
What matters most is where you sit in the spread. The top quarter of pages convert above 3.73%, and the top tenth convert above 7.47%. At the other end, the bottom quarter of pages convert below 0%, which shows that a paid search click leading to no conversions is common. Many pages need time, testing and closer ad-to-page alignment to move above zero.
Leadpages data
Form conversion rates for pages published with Leadpages, by where the visitor came from, over the 90 days to 2026-11-16. A form conversion rate is the share of visits to a page in which the visitor submitted its form. Each figure is a median or quartile across pages. It describes the pages in a group, not what causes the difference between groups.
more than 5,700 published pagesAs of November 17, 2026
1.04%
Median form conversion rate, visitors from Google Ads
0%
Bottom quarter converts below, visitors from Google Ads
3.73%
Top quarter converts above, visitors from Google Ads
| Measure | Value |
|---|---|
| Median form conversion rate, visitors from Google Ads | 1.04% |
| Bottom quarter converts below, visitors from Google Ads | 0% |
| Top quarter converts above, visitors from Google Ads | 3.73% |
| Top tenth converts above, visitors from Google Ads | 7.47% |
| Median form conversion rate, visitors from Facebook and Instagram ads | 1.92% |
| Bottom quarter converts below, visitors from Facebook and Instagram ads | 0.09% |
| Top quarter converts above, visitors from Facebook and Instagram ads | 9.42% |
| Top tenth converts above, visitors from Facebook and Instagram ads | 22.4% |
| Median form conversion rate, paid search visitors | 1.05% |
| Median form conversion rate, paid social visitors | 1.93% |
| Median form conversion rate, organic search visitors | 0.89% |
| Median form conversion rate, organic social visitors | 8.3% |
| Median form conversion rate, email visitors | 2.27% |
| Median form conversion rate, referral visitors | 2.04% |
| Median form conversion rate, direct visitors | 1.14% |
| Median form conversion rate, all pages | 1.96% |
Median form conversion rate, visitors from Google Ads
Bottom quarter converts below, visitors from Google Ads
Top quarter converts above, visitors from Google Ads
Top tenth converts above, visitors from Google Ads
Median form conversion rate, visitors from Facebook and Instagram ads
Bottom quarter converts below, visitors from Facebook and Instagram ads
Top quarter converts above, visitors from Facebook and Instagram ads
Top tenth converts above, visitors from Facebook and Instagram ads
Median form conversion rate, paid search visitors
Median form conversion rate, paid social visitors
Median form conversion rate, organic search visitors
Median form conversion rate, organic social visitors
Median form conversion rate, email visitors
Median form conversion rate, referral visitors
Median form conversion rate, direct visitors
Median form conversion rate, all pages
Based on more than 5,700 published pages. As of November 17, 2026.
What a typical Google Ads conversion rate looks like
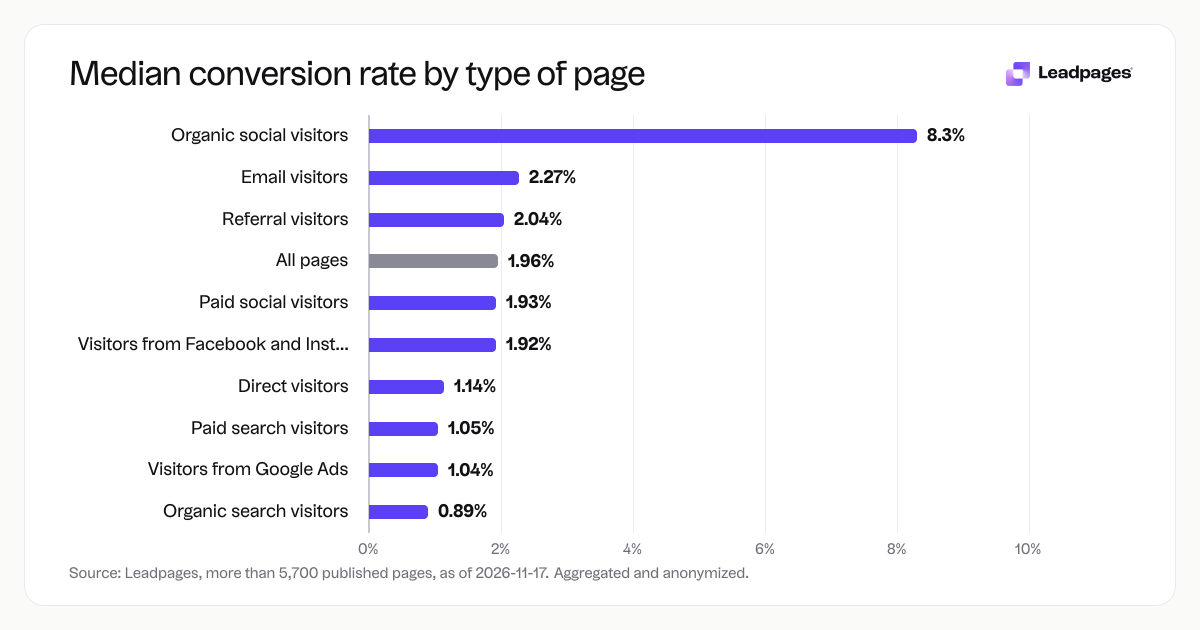
If you look at paid search traffic, the median form conversion rate across our data is 1.04%. Use that number to check your own Google Ads pages. The median for all paid search visitors (not just Google Ads) is similar at 1.05%.
Context helps. For the same period, pages that drew visitors from paid social (Facebook and Instagram ads) had a median conversion rate of 1.93%. Pages from organic social sources convert at a median of 8.3%, but that group is different: people arrive from a link shared by someone they trust, so the page is not cold traffic the way a Google Ads landing page is. Email traffic pages convert at a median of 2.27%, referral traffic at 2.04%, direct traffic at 1.14%, and organic search at 0.89%. The overall median across all traffic sources is 1.96%.
These figures describe the pages, not the traffic sources. A page built for a Google Ads campaign often has a harder job than a page sent to an email list. It must convince someone who typed a search phrase, clicked an ad and landed on a page with no prior relationship. That is why the numbers are lower, and why any page converting above the median is doing solid work.
How the numbers break down by source
When you split Google Ads landing pages into quartiles, the spread is clear.
- Bottom quartile: converts below 0%
- Median: 1.04%
- Top quartile: converts above 3.73%
- Top decile (top tenth): converts above 7.47%
Compare that with pages that get their traffic from Facebook and Instagram ads. Their spread looks like this.
- Bottom quartile: converts below 0.09%
- Median: 1.92%
- Top quartile: converts above 9.42%
- Top decile: converts above 22.4%
The paid social numbers have a much wider range. The top paid social pages convert at rates you rarely see in paid search. That does not mean paid social is better; the mechanics differ. A Facebook ad can use richer targeting and creative, and the landing page often matches a specific audience. A Google Ads page typically matches a keyword intent. Both work, but the shapes of the distributions differ.
Organic search pages (median 0.89%) sit just below paid search. That makes sense: someone coming from a search result might be earlier in their research and less ready to act than someone who clicked a commercial ad. The top quartile for organic search is lower than paid search’s top quartile, but not by much.
If your page combines multiple traffic sources, the overall median across all pages in the sample is 1.96%. That figure mixes email, referral, direct and social, so it is less useful for benchmarking a page that only gets Google Ads traffic. Use the paid search medians instead.
What the top quarter of Google Ads landing pages does differently
We cannot see inside every page. But the data shows that the gap between a 1.04% median and a 3.73% top-quartile threshold is real and repeatable. Pages in that top group often share a few patterns.
They match the ad promise. Someone clicks a Google Ad that says “free landscaping estimate” and lands on a page where the headline and form ask for exactly that, with no detour. Pages that send visitors to a generic home page or a page that promises something different lose people in the first few seconds.
They keep the form short. The conversion action on these pages is usually a form submission. A page asking for a first name, email and maybe a phone number tends to out-convert a page that asks for a dozen fields at once. If the offer justifies more fields (a loan application, a detailed quote), these pages often break the form into steps or collect lighter fields first.
They use a single call to action. The page has one job, and everything points to that action. Top-quartile pages are less likely to scatter alternate offers, navigation links or exit paths that dilute the main ask.
They run with a well-structured Google Ads campaign. The page alone is not the answer. The campaign uses tight ad groups, negative keywords and ad copy that primes the visitor. When the ad sets the right expectation, the page has an easier job converting.
They get tested. Small changes in headline wording, button color, or form placement move conversion rates. The top decile (7.47%) does not happen on the first try. Teams that treat the page as something to improve over time, not something to launch and forget, tend to climb into the higher quartiles.
None of these are guarantees. But across thousands of pages, the ones that do these things often cluster in the top quarter.
How to read your own Google Ads conversion rate
Start with the base: a median of 1.04% for paid search pages. If your page is new and you have only a few hundred clicks, do not panic at a low number. Small samples swing. Wait until you have enough visits that the rate settles. As a rule of thumb, aim for at least 300 to 500 visitors from the same campaign and the same landing page before drawing conclusions.
If your rate is at 0%, meaning no form submissions, check the basics first. Is the form working? Is the tracking tag firing? These sound obvious, but a broken form or missing tag causes a zero rate more often than people think. Once the mechanics are sound, look at the match between the ad and the page. If the ad says “free consultation” and the page does not offer that, visitors leave.
If your page sits around the median, you are in the normal range. The next question is whether the business model can work at that conversion rate. A real estate agent might be happy with a rate around the median if each lead is valuable. An ecommerce brand selling a low-margin item might need to push higher. The number alone is not the goal. The goal is a rate that makes your ad spend profitable.
If you want to move from the median toward the top quartile (above 3.73%), treat it as a series of small steps. Change one element, measure the result, then keep or revert. That discipline matters more than any single best practice.
The free Leadpages landing page analyzer gives you a quick score across headline, form, call to action and mobile layout. It is a practical first step when you are not sure what to fix.
How we measured these benchmarks
The figures come from form conversion rates on more than 5,700 pages published with Leadpages, aggregated and anonymized. The data covers the 90 days up to 2026-11-16. We looked at the share of visits to a page in which the visitor submitted its form, then grouped pages by the source of the visit (Google Ads, paid social, organic search, email, and so on).
Each figure is a median or quartile across the pages in that group. It describes the pages, not the visitors. So a median of 1.04% for Google Ads means that when you line up all those pages from lowest to highest, the one in the middle converts at 1.04%. The bottom quarter falls below the bottom figure, and the top quarter exceeds the top figure.
We treat these as benchmarks, not causal findings. A page that converts above the median is not better because of the benchmark. It simply outperforms the middle of the pack. Use the numbers to know where you stand, then improve from there. To find quick wins on your own page, score it now with the landing page analyzer.