
Landing page benchmarks
Page Speed Conversion Rate: Benchmarks from 5,700+ Landing Pages
Page speed conversion rate data from more than 5,700 landing pages. See how load time relates to form conversion rates and where your page stands.
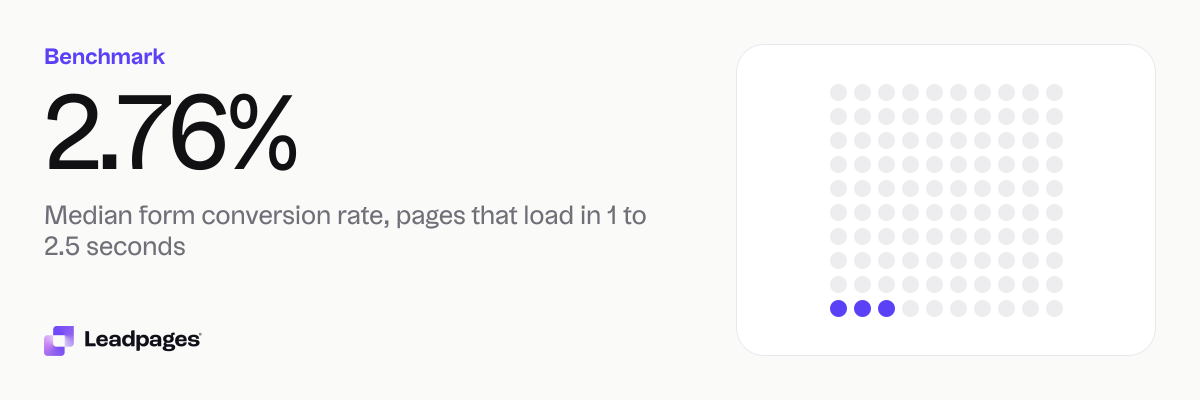
Faster pages convert more visitors. Across more than 5,700 landing pages published with Leadpages, pages that loaded in 1 to 2.5 seconds had a median form conversion rate of 2.76%. Pages that took over four seconds converted at a median of 0.88%. Shaving seconds off load time is one of the simplest ways to get more leads.
Leadpages data
Form conversion rates for pages published with Leadpages, by page load time, over the 90 days to 2026-11-16. A form conversion rate is the share of visits to a page in which the visitor submitted its form. Each figure is a median or quartile across pages. It describes the pages in a group, not what causes the difference between groups.
more than 5,700 published pagesAs of November 17, 2026
2.76%
Median form conversion rate, pages that load in 1 to 2.5 seconds
0.39%
Bottom quarter converts below, pages that load in 1 to 2.5 seconds
16.7%
Top quarter converts above, pages that load in 1 to 2.5 seconds
| Measure | Value |
|---|---|
| Median form conversion rate, pages that load in 1 to 2.5 seconds | 2.76% |
| Bottom quarter converts below, pages that load in 1 to 2.5 seconds | 0.39% |
| Top quarter converts above, pages that load in 1 to 2.5 seconds | 16.7% |
| Top tenth converts above, pages that load in 1 to 2.5 seconds | 39.9% |
| Median form conversion rate, pages that load in 2.5 to 4 seconds | 1.91% |
| Bottom quarter converts below, pages that load in 2.5 to 4 seconds | 0.02% |
| Top quarter converts above, pages that load in 2.5 to 4 seconds | 9.73% |
| Top tenth converts above, pages that load in 2.5 to 4 seconds | 32.3% |
| Median form conversion rate, pages that take over 4 seconds to load | 0.88% |
| Bottom quarter converts below, pages that take over 4 seconds to load | 0% |
| Top quarter converts above, pages that take over 4 seconds to load | 3.98% |
| Top tenth converts above, pages that take over 4 seconds to load | 18.4% |
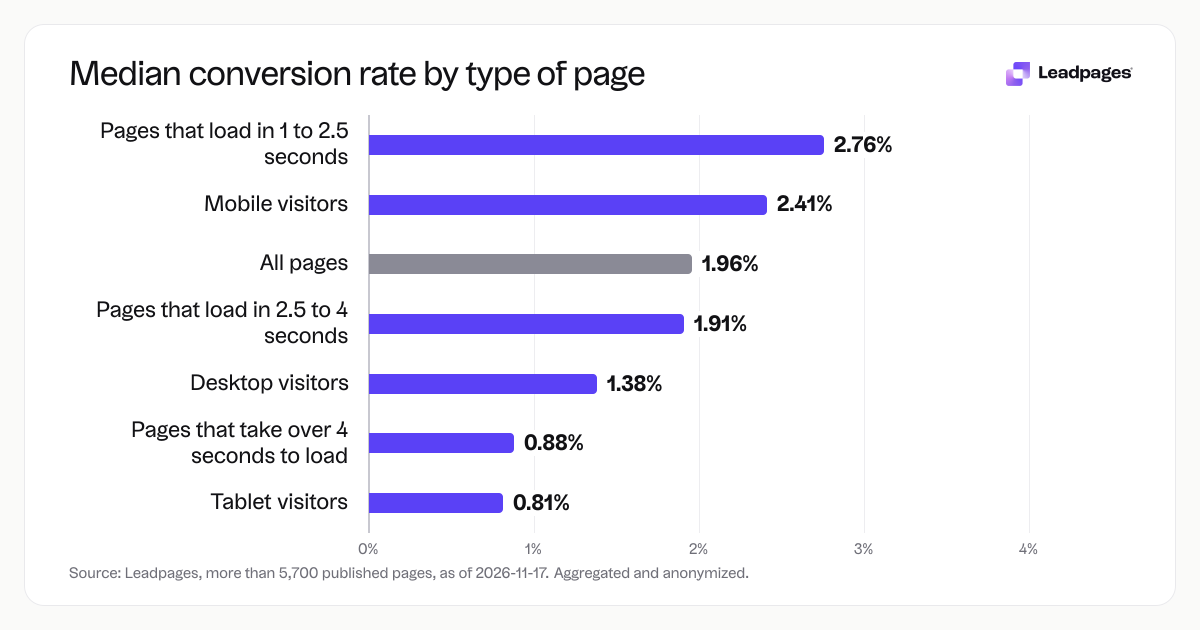
| Median form conversion rate, mobile visitors | 2.41% |
| Median form conversion rate, desktop visitors | 1.38% |
| Median form conversion rate, tablet visitors | 0.81% |
| Median form conversion rate, all pages | 1.96% |
Median form conversion rate, pages that load in 1 to 2.5 seconds
Bottom quarter converts below, pages that load in 1 to 2.5 seconds
Top quarter converts above, pages that load in 1 to 2.5 seconds
Top tenth converts above, pages that load in 1 to 2.5 seconds
Median form conversion rate, pages that load in 2.5 to 4 seconds
Bottom quarter converts below, pages that load in 2.5 to 4 seconds
Top quarter converts above, pages that load in 2.5 to 4 seconds
Top tenth converts above, pages that load in 2.5 to 4 seconds
Median form conversion rate, pages that take over 4 seconds to load
Bottom quarter converts below, pages that take over 4 seconds to load
Top quarter converts above, pages that take over 4 seconds to load
Top tenth converts above, pages that take over 4 seconds to load
Median form conversion rate, mobile visitors
Median form conversion rate, desktop visitors
Median form conversion rate, tablet visitors
Median form conversion rate, all pages
Based on more than 5,700 published pages. As of November 17, 2026.
The short answer: speed shapes your conversion number
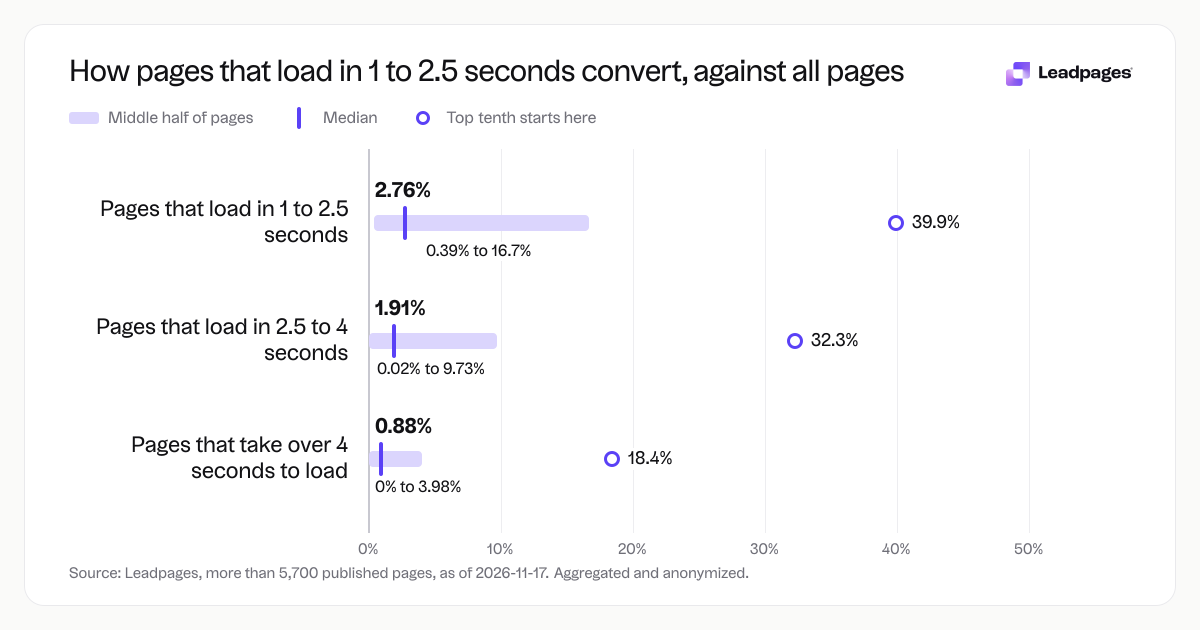
The pattern holds across the middle too. The median conversion rate across all pages we measured is 1.96%. If your page loads between 1 and 2.5 seconds, the median rises to 2.76%. Once load time crosses four seconds, the median drops to less than a third of that. Across every quartile we checked, faster pages convert more visitors who see the form.
Take a real estate agent running a home valuation page. They can expect roughly three times as many form submissions per 100 visits when the page loads in two seconds instead of five. That is from the actual performance of thousands of live pages.
How the numbers break down by load time
We grouped pages by load time and looked at the form conversion rate for each group. Here is what the data shows.
| Load time | Median conversion rate | Bottom quarter converts below | Top quarter converts above | Top tenth converts above |
|---|---|---|---|---|
| 1 to 2.5 seconds | 2.76% | 0.39% | 16.7% | 39.9% |
| 2.5 to 4 seconds | 1.91% | 0.02% | 9.73% | 32.3% |
| Over 4 seconds | 0.88% | 0% | 3.98% | 18.4% |
The median shows what a typical page in that speed group achieves. The bottom quarter and top quarter show the spread. For example, a page that loads in 1 to 2.5 seconds and converts at 16.7% is performing better than three-quarters of pages with similar load times. A page in the same speed group that converts at 39.9% sits in the top tenth.
A few things stand out. The bottom quarter for pages taking over four seconds is 0%: a quarter of those pages got no form submissions during the measurement period. Even among the top tenth, pages over four seconds reached 18.4%, while the top tenth of fast pages reached 39.9%. Moving from the slowest group to the fastest roughly doubles the ceiling for a top performer.
Device type adds another layer. The median form conversion rate for mobile visitors is 2.41%. On desktop, it is 1.38%. Tablets bring 0.81%. Many mobile visitors leave if a page feels sluggish, so fast load times matter more for traffic from phones. If your landing page gets most of its visits from mobile ads or social posts, every extra second hurts more than it would on a wired desktop connection.
What the top quarter does differently
In the fastest group, the top quarter convert at 16.7% or higher. The top tenth reach 39.9%. These pages are from small businesses, coaches, agencies and solo operators using the same builder.
The data does not list their exact tactics. It shows the conversion rates they achieved. To move closer to those thresholds, first get your load time into the 1 to 2.5-second bracket. After that, the gap between a middle page and a top-quarter page comes from fundamentals: a clear headline that matches the ad or link, a form that asks only for what you need, and an offer worth trading an email address for.
Here are practical steps to speed up any landing page:
- Compress images before you upload them. A full-resolution photo can add seconds without any gain on a phone screen.
- Remove extra scripts and tracking pixels. Each third-party snippet adds a request the browser must handle.
- Use a builder that serves pages fast on all devices. Check time to first paint and largest contentful paint in a tool like Lighthouse.
- Keep the page simple. Animated backgrounds, autoplay videos and carousels often add load time without raising conversions.
Once your page loads fast, your result still depends on the offer and the audience. A page that loads in two seconds but has a vague headline or a ten-field form can underperform a slower page with a sharp promise. Speed gets the visit. The rest of the page wins the lead.
How to read your own number
Start by measuring your page’s load time. Google PageSpeed Insights shows real-world times from actual visitors. You can also open your browser’s developer tools and check the network tab on a throttled connection.
Next, know your current form conversion rate. Divide the number of form submissions over a set period by the number of unique visits to the page (or visits where the form was visible). Use a period long enough to smooth out daily noise. A week is a decent minimum. A month is better if your traffic is low.
Find where you sit in the table above. If your page loads in 3.8 seconds and converts at 9.73%, you are in the 2.5 to 4-second group and well above the median for that group. Your first priority is to keep your offer and copy strong while trimming load time toward the fast bracket. If your page loads in two seconds but converts at 0.39%, you are in the fastest group but below the median. The data suggests speed is not the thing holding you back. You will likely gain more from reworking your headline, adding social proof or shortening your form.
The free landing page analyzer from Leadpages scores your page across speed, copy, design and trust factors. It gives you a benchmark you can compare to these groups and points to the most likely places to improve. Run your page through it to see which lever to pull first.
How we measured this
The numbers come from form conversion rates on pages published with Leadpages over a 90-day window ending on 16 November 2026. A form conversion rate is the share of visits to a page in which the visitor submitted the page’s form. We looked at more than 5,700 published pages, all aggregated and anonymized. Each figure is a median or quartile across pages. It describes the pages in that group, not what caused the differences between groups.
We split pages into three load time groups based on measured page speed. Then we calculated the median, bottom-quarter, top-quarter and top-tenth conversion rates for each group. Device-type medians come from the same pool of pages over the same period.
This is not a controlled experiment. It is a snapshot of how pages that load at different speeds performed in the real world. Use it as a reference point, not a formula. The numbers will shift as traffic, devices and page designs change. We update this data periodically, so check back for a current view.
To see where your landing page stands, score your page with the free analyzer. It will show your strengths, highlight what to fix and help you work toward the numbers the top performers are hitting now.