
Landing page benchmarks
Conversion Rate Optimisation Audit: Landing Page Benchmarks You Can Compare
Use real conversion rate benchmarks for your optimisation audit. See median rates by industry and page type. Compare your page today.
A conversion rate optimisation audit starts with knowing what “good” looks like for your kind of page. Across more than 13,000 pages published with Leadpages, the median conversion rate is 15.7%. That gives you a baseline, but the number that matters for your audit depends on your industry and the type of page you run.
Here are the benchmarks, broken down so you can spot where your page sits and what to work on next.
Leadpages data
Conversion rates for pages published with Leadpages, by industry and page type
more than 13,000 published pagesAs of November 20, 2026
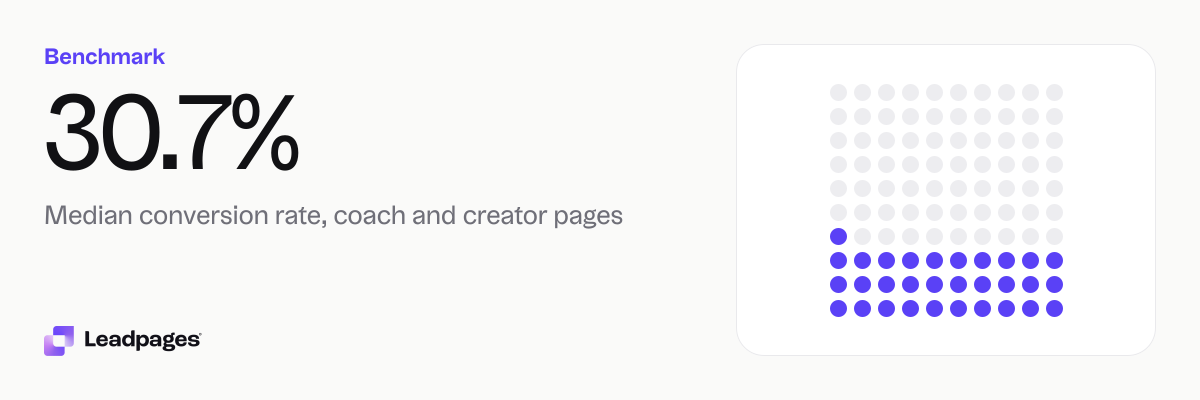
30.7%
Median conversion rate, coach and creator pages
19.8%
Median conversion rate, education pages
11.2%
Median conversion rate, healthcare pages
| Measure | Value |
|---|---|
| Median conversion rate, coach and creator pages | 30.7% |
| Median conversion rate, education pages | 19.8% |
| Median conversion rate, healthcare pages | 11.2% |
| Median conversion rate, finance pages | 14.9% |
| Median conversion rate, ecommerce pages | 6.84% |
| Median conversion rate, real estate pages | 9.65% |
| Median conversion rate, local service pages | 8.22% |
| Median conversion rate, squeeze and opt-in pages | 34.9% |
| Median conversion rate, webinar registration pages | 29.2% |
| Median conversion rate, landing pages | 15.6% |
| Median conversion rate, product pages | 9.25% |
| Median conversion rate, sales pages | 6.97% |
| Median conversion rate, all pages | 15.7% |
| Bottom quarter converts below, all pages | 4.66% |
| Top quarter converts above, all pages | 39% |
| Top tenth converts above, all pages | 62.4% |
| Share converting at 10% or better, all pages | 59.9% |
Median conversion rate, coach and creator pages
Median conversion rate, education pages
Median conversion rate, healthcare pages
Median conversion rate, finance pages
Median conversion rate, ecommerce pages
Median conversion rate, real estate pages
Median conversion rate, local service pages
Median conversion rate, squeeze and opt-in pages
Median conversion rate, webinar registration pages
Median conversion rate, landing pages
Median conversion rate, product pages
Median conversion rate, sales pages
Median conversion rate, all pages
Bottom quarter converts below, all pages
Top quarter converts above, all pages
Top tenth converts above, all pages
Share converting at 10% or better, all pages
Based on more than 13,000 published pages. As of November 20, 2026.
The Short Answer: What a Healthy Conversion Rate Looks Like
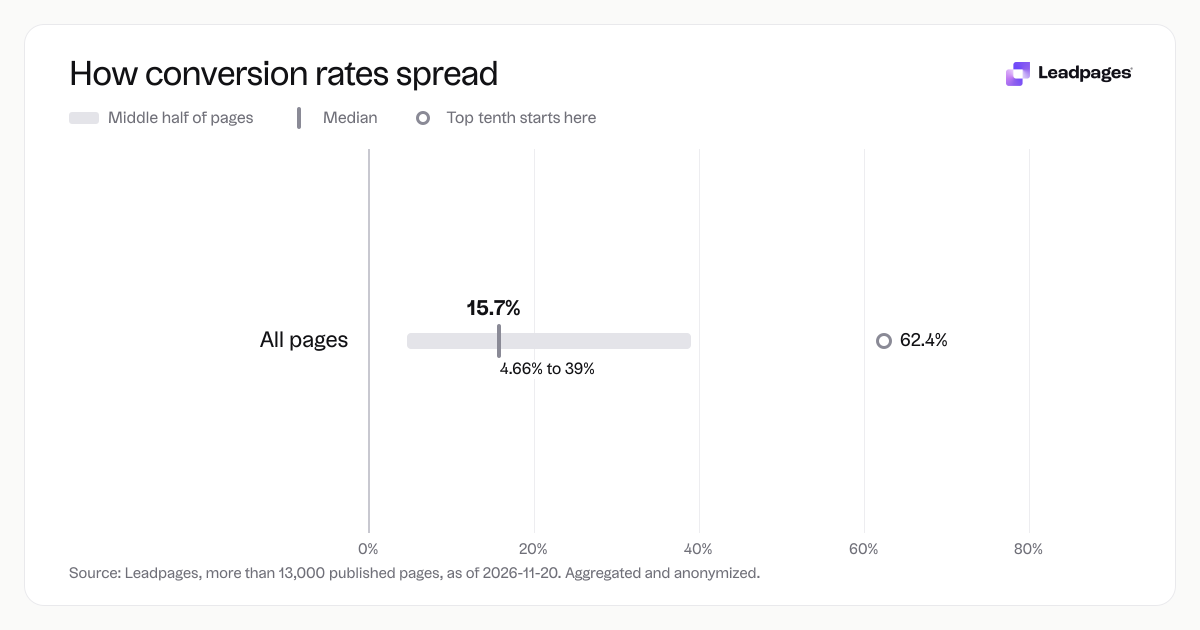
If you want a single number to keep in mind, 15.7% is the median across all pages we measured. Half of pages convert above that, and half below. A conversion rate optimisation audit uses that midpoint to ask: is your page above or below it?
But a 15.7% median hides a wide spread. A squeeze page for a coach works differently than a sales page for a physical product. Use the tables below to pick the benchmark that matches your situation.
How the Numbers Break Down by Industry
Your industry shapes visitor intent before they see your page. Someone researching a healthcare provider has different goals than someone browsing a product. These medians show how conversion rates differ across common industries among Leadpages pages.
| Industry | Median conversion rate |
|---|---|
| Coach and creator pages | 30.7% |
| Education pages | 19.8% |
| Finance pages | 14.9% |
| Healthcare pages | 11.2% |
| Real estate pages | 9.65% |
| Local service pages | 8.22% |
| Ecommerce pages | 6.84% |
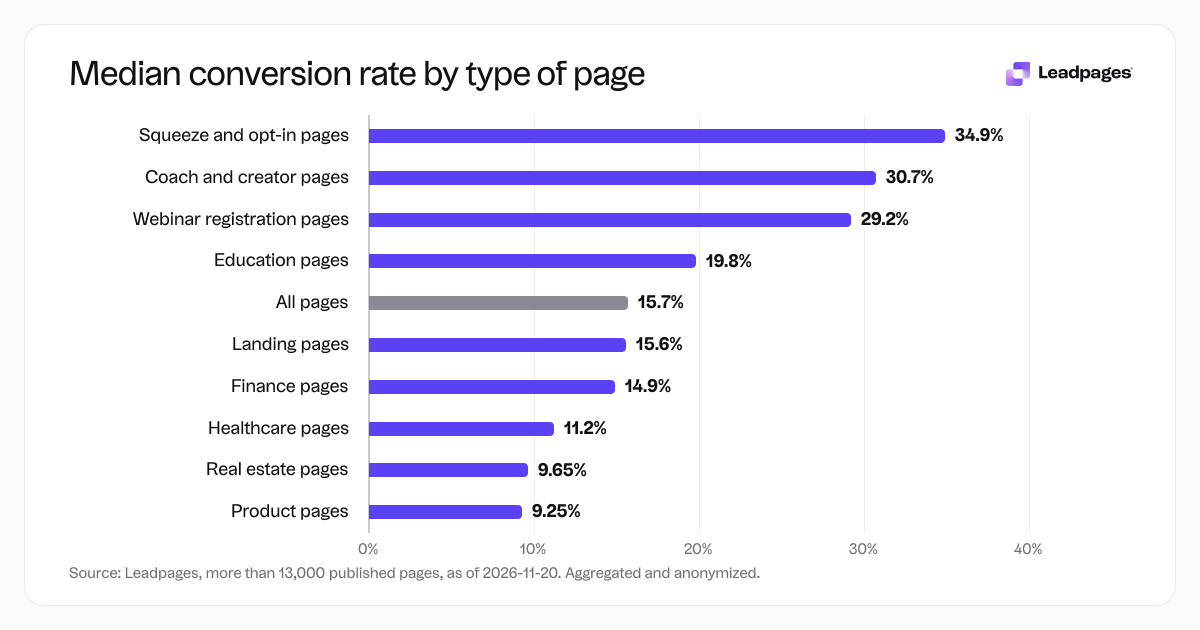
Coaches and creators see the highest median (30.7%), often because they promote a single lead magnet or consultation to a warm audience. Ecommerce pages land at 6.84%, where a purchase is a bigger ask than an email signup.
When you audit your own page, start with the industry row that fits. If you run a real estate lead capture page and your rate sits below the industry median of 9.65%, that gap tells you where to focus testing.
How the Numbers Break Down by Page Type
The page type matters as much as the industry. A simple opt-in page sees far more conversions than a long-form sales page, even for the same business. Use this breakdown to choose the right benchmark for your audit.
| Page type | Median conversion rate |
|---|---|
| Squeeze and opt-in pages | 34.9% |
| Webinar registration pages | 29.2% |
| Landing pages (general) | 15.6% |
| Product pages | 9.25% |
| Sales pages | 6.97% |
Squeeze and opt-in pages (34.9%) ask for a single action, typically an email address. Webinar registration pages (29.2%) also keep the ask small and tie it to a live event. Sales pages (6.97%) ask for money, which usually produces a lower median.
Match your page to both the industry and page type benchmarks. A financial advisor running a webinar registration page should compare to the finance industry median (14.9%) and the webinar page median (29.2%). If their page converts above the finance industry median but still falls short of the webinar page median, that points to testing the registration form or headline rather than the offer itself.
What the Top Quarter Does Differently
The median splits the middle. The top quarter of pages converts above 39%, and the top tenth converts above 62.4%. Those high performers follow a pattern you can copy.
Pages in the top quarter tend to do a few things the same way:
- They focus on one action. A page that asks for a name and email will usually out-convert a page that lists three services, a phone number and a newsletter signup. Every extra choice splits attention and costs conversions.
- They offer a specific benefit above the fold. The visitor knows within seconds what they will get. A headline like “Get the checklist” paired with a form beats “Welcome to our resource center.”
- They remove navigation and exit links. A landing page with no menu bar keeps the visitor on the page until they convert or leave. Pages with standard website navigation tend to underperform.
- They test and keep testing. Small changes to button text, form fields and images can move a page from the middle to the top quarter. Use an A/B test calculator to confirm the winner before you commit.
You can get a fast read on your page with the free landing page analyzer. It scores your page on clarity, load speed and mobile layout, and gives you a short list of improvements that push you toward that top quarter.
How to Read Your Own Number During an Audit
A conversion rate optimisation audit answers three questions for one page: what is my rate, what should it be, and where is the biggest gap. Here is how to make the benchmarks useful.
Find your actual rate. Look at the last 30 days of data on your page. Divide conversions by unique visitors and multiply by 100. If you use Leadpages analytics, this number sits on your main dashboard. Do not go back further than 90 days; old data can hide a recent drop.
Pick the closest benchmark. Match your page to an industry and a page type from the tables above. If you fall between two categories, pick the one that feels closest and write down both medians.
Identify the gap. Suppose you run a local service page for a plumbing company and your conversion rate is below the local service median of 8.22%. The landing page median is 15.6%. Your gap could be several percentage points, which means you can aim to substantially lift your rate before you approach the overall median.
Prioritise one change. Start where the gap is smallest. That points you to work on the page itself rather than the traffic source. Test your headline with a headline analyzer, reduce the number of form fields, or rewrite your call to action before you spend more on ads.
Remember that a median is a midpoint. If your page converts at a rate that's comfortably above your closest benchmark, you are well into the top half. Your audit should still look for incremental wins, but the data says your foundation works.
What Counts as a “Good” Rate Across All Pages
59.9% of all pages we looked at convert at double-digit rates. If your page clears that mark, your audit shifts from fixing big problems to chasing smaller, harder gains. Pages that sit below 4.66% land in the bottom quarter. At that level, the page itself is the bottleneck, and a full redesign often makes more sense than testing individual elements.
Use these thresholds to set the ambition for your audit:
- Below 4.66%: rebuild the page with a single offer and a short form.
- Between 4.66% and 15.7%: test one section at a time, starting with the headline.
- Between 15.7% and 39%: you are above the median. Focus on tightening your copy and testing different offers.
- Above 39%: you are in the top quarter. Test against the same audience to guard against a drop; use an A/B testing tool to validate every change.
How We Measured This
We looked at more than 13,000 published pages. Aggregated and anonymized; as of 2026-11-20. The conversion rate for each page was calculated as the number of form submissions or purchases divided by unique visitors, over a standardised time window. We reported the median for each group because medians resist outlier pages that convert at near 0% or near 100%.
No one page tells the full story, but this data set gives you a fair peer group for your audit. Compare your page to the industry and page type that match, and you will have a clearer sense of where to invest your testing time.
Start by scoring your page now: score your landing page.