
Landing page benchmarks
How to Boost Conversion Rate: Benchmarks from 13,000+ Pages
See real conversion rate data from over 13,000 Leadpages landing pages, broken down by industry and page type. Learn what top performers do differently.
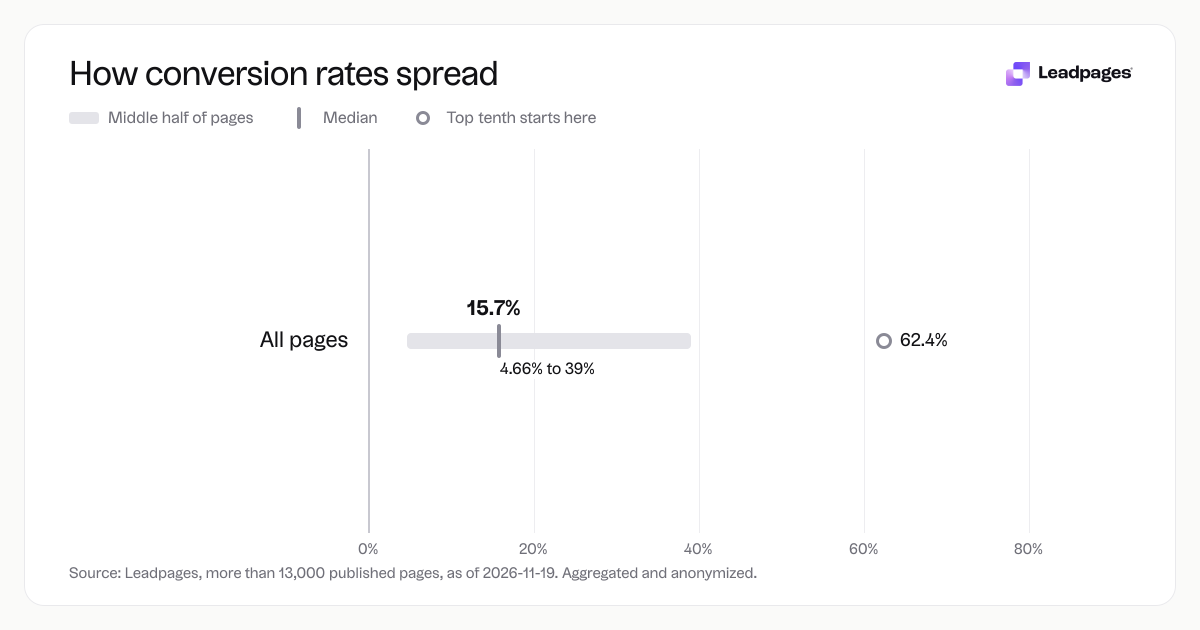
If you’re trying to boost conversion rate, start by knowing what’s realistic. Across more than 13,000 pages published with Leadpages, the median conversion rate is 15.7%. Half of pages sit below that, half above, and small improvements can move you up fast.
Leadpages data
Conversion rates for pages published with Leadpages, by industry and page type
more than 13,000 published pagesAs of November 19, 2026
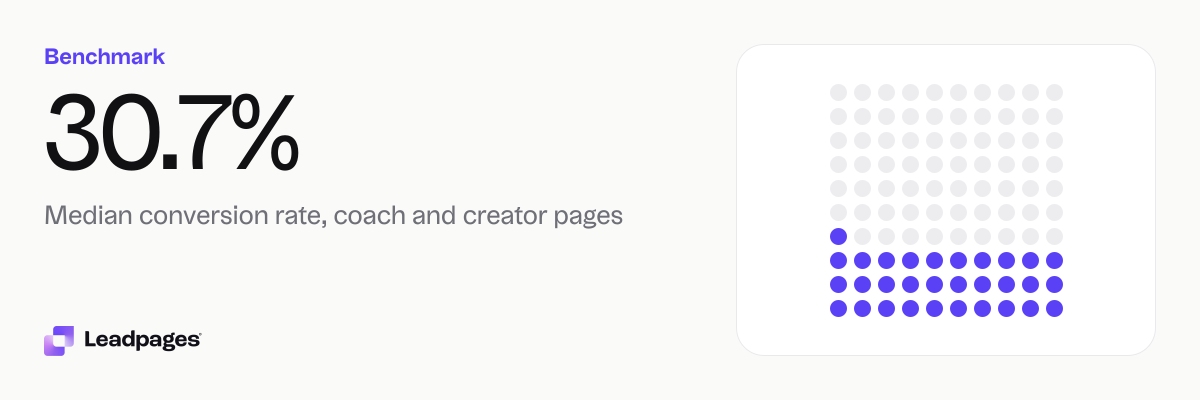
30.7%
Median conversion rate, coach and creator pages
19.8%
Median conversion rate, education pages
11.2%
Median conversion rate, healthcare pages
| Measure | Value |
|---|---|
| Median conversion rate, coach and creator pages | 30.7% |
| Median conversion rate, education pages | 19.8% |
| Median conversion rate, healthcare pages | 11.2% |
| Median conversion rate, finance pages | 14.9% |
| Median conversion rate, ecommerce pages | 6.84% |
| Median conversion rate, real estate pages | 9.65% |
| Median conversion rate, local service pages | 8.22% |
| Median conversion rate, squeeze and opt-in pages | 34.9% |
| Median conversion rate, webinar registration pages | 29.2% |
| Median conversion rate, landing pages | 15.6% |
| Median conversion rate, product pages | 9.25% |
| Median conversion rate, sales pages | 6.97% |
| Median conversion rate, all pages | 15.7% |
| Bottom quarter converts below, all pages | 4.66% |
| Top quarter converts above, all pages | 39% |
| Top tenth converts above, all pages | 62.4% |
| Share converting at 10% or better, all pages | 59.9% |
Median conversion rate, coach and creator pages
Median conversion rate, education pages
Median conversion rate, healthcare pages
Median conversion rate, finance pages
Median conversion rate, ecommerce pages
Median conversion rate, real estate pages
Median conversion rate, local service pages
Median conversion rate, squeeze and opt-in pages
Median conversion rate, webinar registration pages
Median conversion rate, landing pages
Median conversion rate, product pages
Median conversion rate, sales pages
Median conversion rate, all pages
Bottom quarter converts below, all pages
Top quarter converts above, all pages
Top tenth converts above, all pages
Share converting at 10% or better, all pages
Based on more than 13,000 published pages. As of November 19, 2026.
The Short Answer
To boost your conversion rate, compare your page to data for your industry and page type. Then improve the big levers: clarify the offer, tighten your call to action, and lower form friction. Use tools to test changes instead of guessing. For a step-by-step plan, read how to increase your conversion rate with benchmarks from thousands of pages.
How the Numbers Break Down
Conversion rates vary by what you sell, who you reach, and the action you want. These medians come from actual Leadpages landing pages, so they reflect the ranges you’ll see in practice.
By Industry
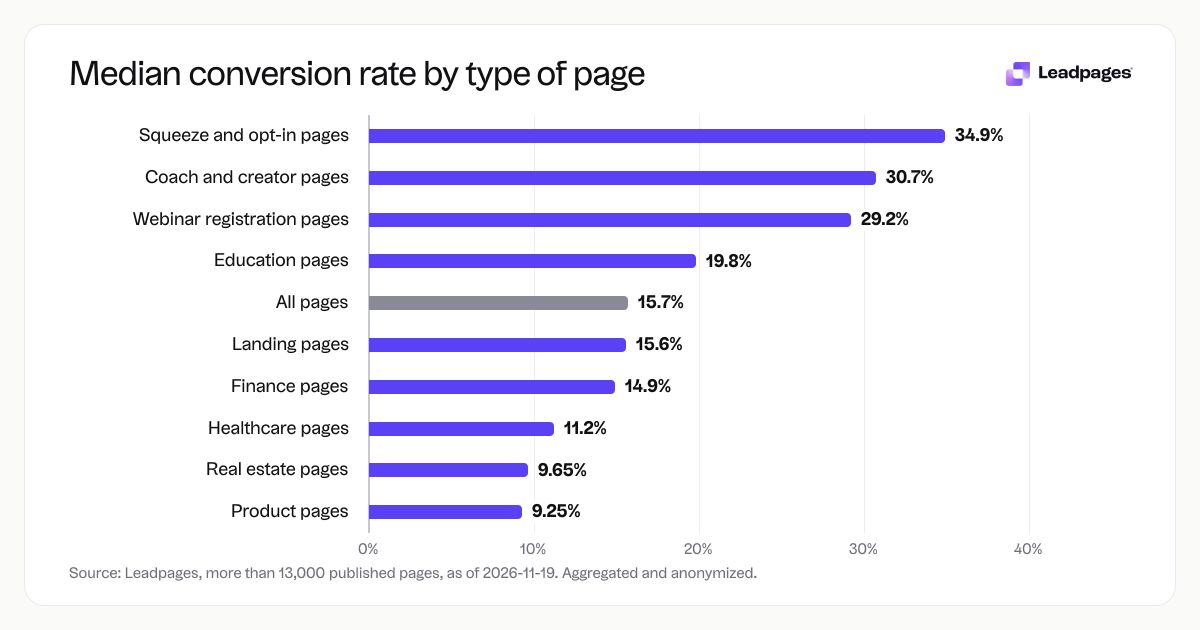
- Coach and creator pages: 30.7%
- Education pages: 19.8%
- Finance pages: 14.9%
- Healthcare pages: 11.2%
- Real estate pages: 9.65%
- Local service pages: 8.22%
- Ecommerce pages: 6.84%
By Page Type
- Squeeze and opt-in pages: 34.9%
- Webinar registration pages: 29.2%
- Landing pages (general): 15.6%
- Product pages: 9.25%
- Sales pages: 6.97%
A squeeze page that trades an email for a free download usually converts far higher than a sales page asking for a card. That doesn’t make one “better”, the ask is different, so the benchmark should be too. Coach pages often reach a median of 30.7% because the offers are free resources tied to personal needs, while ecommerce product pages sit at 9.25% due to higher commitment. Know this spread before you optimize so you set fair targets.
What the Top Quarter Does Differently
While the median across all pages is 15.7%, the top quarter converts above 39% and the top tenth clears 62.4%. Pages at that level tend to share a few traits:
- A sharp offer that matches the traffic source. If an ad promises a template, the page delivers that template, nothing else.
- One clear call to action, with no competing links or secondary asks.
- Minimal friction. The form collects only what you truly need.
If your page is below that threshold, first make sure your value proposition is obvious within seconds. A visitor should know what you offer and what to do next. Check your above the fold conversion rate to see how much that instant clarity matters. Then try the free headline analyzer to refine your heading, and use the call-to-action generator to craft button copy that removes doubt. After any change, verify impact with the A/B test calculator. If you trim fields, see how each one affects submissions with our form fields benchmarks.
How to Read Your Own Number
Compare your conversion rate to the median for your industry or page type, not just the overall number. If your coach landing page converts below the 30.7% median for coach and creator pages, that flags your offer, headline, or form logic for a rethink. For an education page, a rate under the 19.8% median suggests you might tighten your course preview or add social proof. Sales pages have a median of 6.97%, so if you’re above that, you’re ahead of most, but you can still target top-quarter territory above 39% by testing a sharper offer or a shorter checkout. Ecommerce product pages sit at a 9.25% median; a rate below that suggests you should refine product copy, images, and trust signals.
Set your first target at the median for your group, then aim for the top quarter as you iterate. To see exactly where you stand, run your page through the free landing page analyzer. It compares your page’s conversion potential to benchmarks like these and gives you specific steps to improve.
How We Measured This
The numbers in this article come from more than 13,000 pages published with Leadpages, aggregated and anonymized, as of 2026-11-19. We measured the percentage of unique visitors who completed the page’s primary goal (typically a form submission, download, registration, or purchase) and then calculated the median conversion rate for each industry category and page type. All medians are the midpoint, meaning half the pages in that group converted at a higher rate and half at a lower rate.
Score your landing page for free with the landing page analyzer. It shows how your page stacks up against real-world data and gives you actionable fixes.