
Landing page benchmarks
Landing Page Navigation Conversion Rate: Data from 5,700+ Pages
Pages without navigation menus convert at 2.39% vs 0.85% for those with. See the full breakdown from 5,700+ Leadpages landing pages.
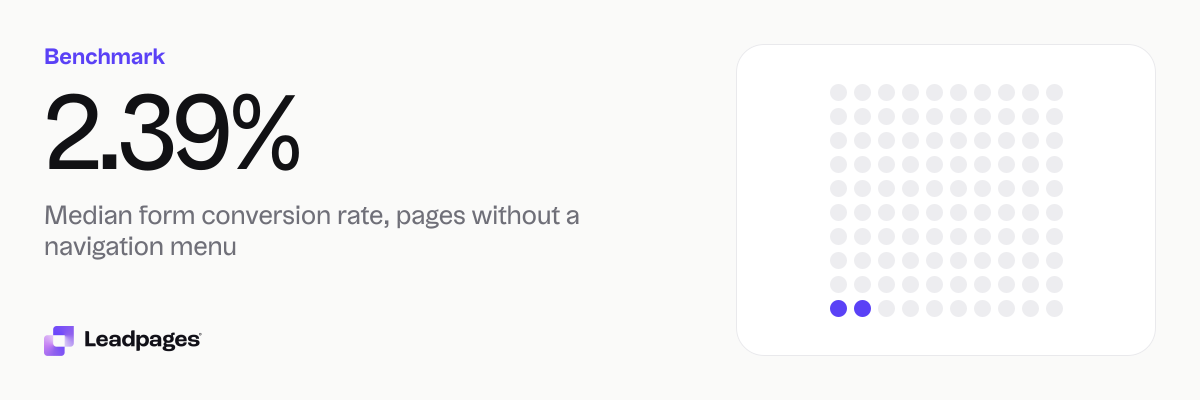
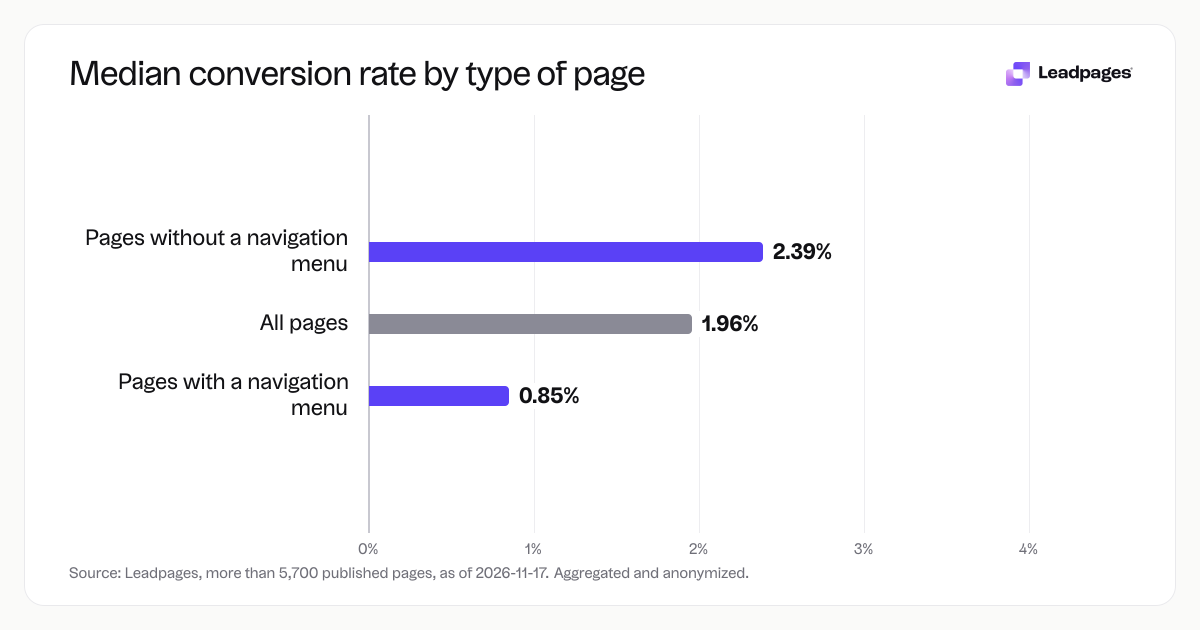
Across pages published with Leadpages, landing pages without a navigation menu convert at a median rate of 2.39%. Pages that include a navigation menu convert at 0.85%. The difference shows up across middle performers, the bottom quarter, and the top tenth.
Leadpages data
Form conversion rates for pages published with Leadpages, with and without a navigation menu, over the 90 days to 2026-11-16. A form conversion rate is the share of visits to a page in which the visitor submitted its form. Each figure is a median or quartile across pages. It describes the pages in a group, not what causes the difference between groups.
more than 5,700 published pagesAs of November 17, 2026
2.39%
Median form conversion rate, pages without a navigation menu
0.24%
Bottom quarter converts below, pages without a navigation menu
14.5%
Top quarter converts above, pages without a navigation menu
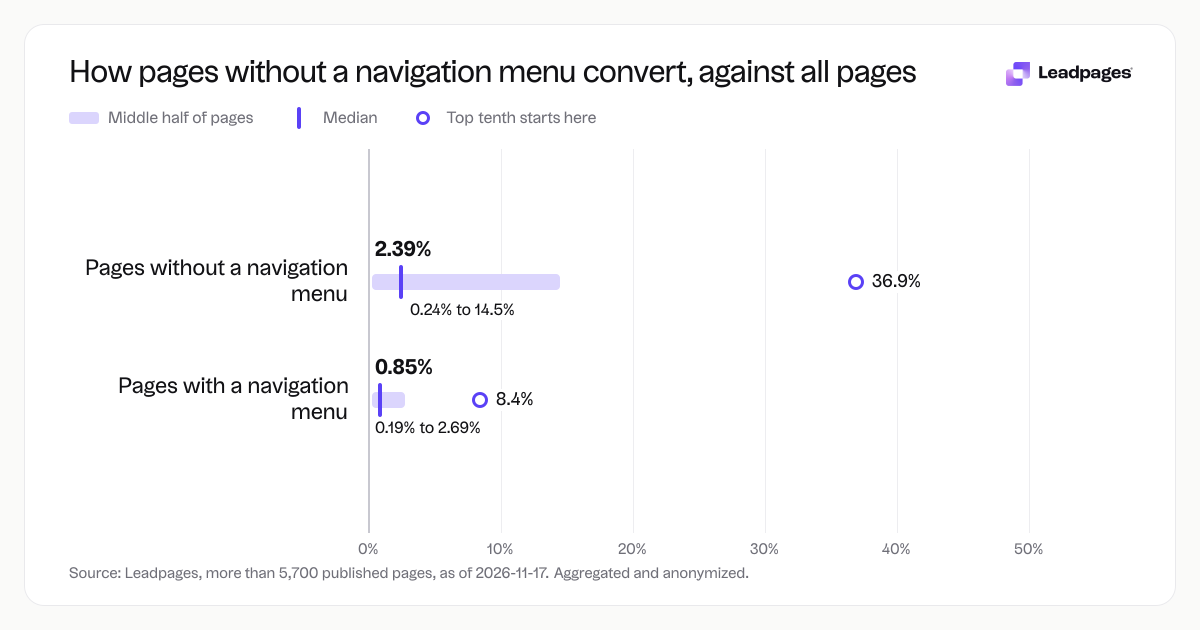
| Measure | Value |
|---|---|
| Median form conversion rate, pages without a navigation menu | 2.39% |
| Bottom quarter converts below, pages without a navigation menu | 0.24% |
| Top quarter converts above, pages without a navigation menu | 14.5% |
| Top tenth converts above, pages without a navigation menu | 36.9% |
| Median form conversion rate, pages with a navigation menu | 0.85% |
| Bottom quarter converts below, pages with a navigation menu | 0.19% |
| Top quarter converts above, pages with a navigation menu | 2.69% |
| Top tenth converts above, pages with a navigation menu | 8.4% |
| Median form conversion rate, all pages | 1.96% |
Median form conversion rate, pages without a navigation menu
Bottom quarter converts below, pages without a navigation menu
Top quarter converts above, pages without a navigation menu
Top tenth converts above, pages without a navigation menu
Median form conversion rate, pages with a navigation menu
Bottom quarter converts below, pages with a navigation menu
Top quarter converts above, pages with a navigation menu
Top tenth converts above, pages with a navigation menu
Median form conversion rate, all pages
Based on more than 5,700 published pages. As of November 17, 2026.
The Short Answer: Navigation Lowers Conversion
If you are deciding whether to keep your main site navigation on a landing page, the numbers point one way. Removing it tends to raise conversions. Median form conversion for pages with a navigation menu is 0.85%, compared with 2.39% for pages without one. The pattern holds at every performance level we measured.
The data comes from more than 5,700 landing pages published through Leadpages and tracked over a 90-day window. It does not prove that removing navigation causes a higher rate, but the gap is large enough to be worth testing on your own page.
How the Numbers Break Down
We grouped pages by whether they included a navigation menu, then looked at median form conversion rates and quartile thresholds. Here is what we saw:
-
Pages without a navigation menu
- Median: 2.39%
- Bottom quarter converts below: 0.24%
- Top quarter converts above: 14.5%
- Top tenth converts above: 36.9%
-
Pages with a navigation menu
- Median: 0.85%
- Bottom quarter converts below: 0.19%
- Top quarter converts above: 2.69%
- Top tenth converts above: 8.4%
-
All pages (with and without navigation)
- Median: 1.96%
A few things stand out. Top quartile pages without a menu outperform the top quartile with a menu by a wide margin. Bottom performers look similar regardless of navigation, which suggests keeping a menu is not what makes a page fail. The biggest differences show up in the middle and the top.
What the Top-Converting Pages Do Differently
The top quarter of pages without navigation menus convert above 14.5%. The top tenth, above 36.9%. These are the pages to study, even if you currently use a navigation menu. Here is what they tend to share:
- A single goal. Every headline, image and line of copy pushes one action: submit the form. There are no links to a pricing page, blog post or about section. The visitor’s choices are convert or leave.
- Tight message match with the traffic source. If someone clicks a paid ad for a free ebook, the landing page headline matches it and the form asks only for what is needed to deliver the ebook. No detours.
- Lean forms. Our related data on form fields shows field count matters, and these pages ask only for information the offer justifies.
- Clear, repeated call-to-action buttons that set expectations. “Get the guide” instead of “Submit.”
If you want a starting point that fits these patterns, browse landing page templates built without navigation menus and with a single focus. Then test your page against what you see.
How to Read Your Own Number
The overall median of 1.96% is a useful reference, but it may not fit your offer. A page that promotes a free newsletter signup will usually convert higher than one that gates a high-ticket consultation. Cold paid traffic often converts lower than traffic from a warm email list.
Use the quartile numbers as goalposts, not one-size-fits-all targets. If your conversion rate sits below the median for your page type (with or without navigation), start there. A practical next step is to test removing your navigation menu and see whether that single change moves you closer to the top quarter for your segment. You can run an A/B test and use a significance calculator to know when the result is reliable.
The top quarter for pages with a menu still converts above 2.69%. A menu alone does not cap performance. But if your page includes a full site header and you are not in the upper tier, testing a no-menu variant gives you a clear, measurable lever.
How We Measured This
The figures in this report come from pages published through Leadpages between late August and mid-November 2026, aggregated and anonymized as of November 17, 2026.
- Sample size: more than 5,700 published landing pages.
- Period: 90 days ending November 16, 2026.
- Metric: form conversion rate. This is the share of page visits in which a visitor submitted the page’s form. For example, if a page received 500 visits and 10 form submissions, the rate is 10 divided by 500.
- Calculation: we computed each page’s conversion rate over the 90 days, then found the median and quartile thresholds across pages. A page did not need a minimum number of visits to be included.
- Grouping: pages were split into two groups based on whether they displayed a navigation menu. We did not control for other factors, so the numbers describe the groups as they existed, not what causes the difference between them.
The data gives you an honest look at how thousands of real pages perform. Use it to guide your own tests, not as a prediction for any single page.
Score your landing page with our free analyzer.