
Landing page benchmarks
Landing Page Elements Conversion Rate: Benchmarks from 5,700+ Pages
See conversion rate data for landing page elements like navigation, testimonials, and video, based on 5,700+ pages. Learn what top-performing pages do differently.
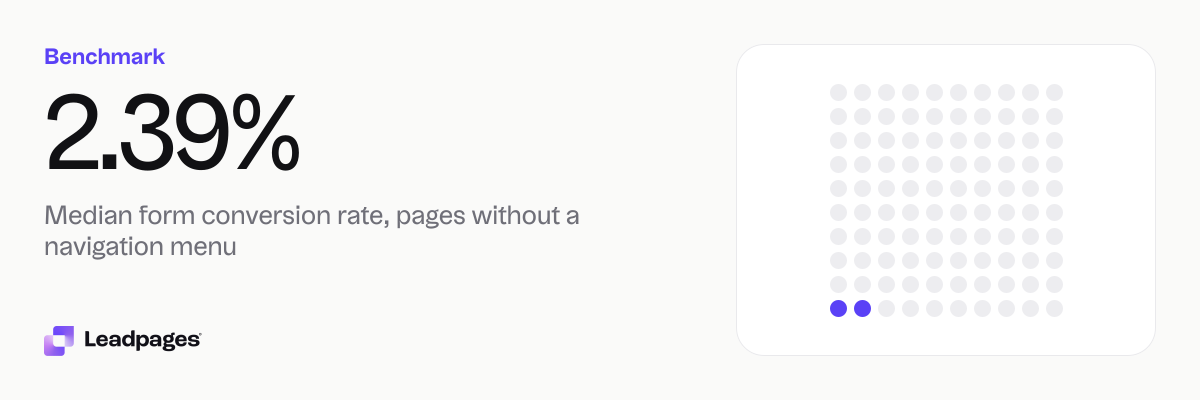
Across more than 5,700 pages built with Leadpages, the median form conversion rate was 1.96%. Pages without a navigation menu converted at 2.39%, compared with 0.85% for pages with one. Pages with video or testimonials tended to have lower medians, though high-converting pages used those elements too.
Leadpages data
Form conversion rates for pages published with Leadpages, with and without a navigation menu, over the 90 days to 2026-11-16. A form conversion rate is the share of visits to a page in which the visitor submitted its form. Each figure is a median or quartile across pages. It describes the pages in a group, not what causes the difference between groups.
more than 5,700 published pagesAs of November 17, 2026
2.39%
Median form conversion rate, pages without a navigation menu
0.24%
Bottom quarter converts below, pages without a navigation menu
14.5%
Top quarter converts above, pages without a navigation menu
| Measure | Value |
|---|---|
| Median form conversion rate, pages without a navigation menu | 2.39% |
| Bottom quarter converts below, pages without a navigation menu | 0.24% |
| Top quarter converts above, pages without a navigation menu | 14.5% |
| Top tenth converts above, pages without a navigation menu | 36.9% |
| Median form conversion rate, pages with a navigation menu | 0.85% |
| Bottom quarter converts below, pages with a navigation menu | 0.19% |
| Top quarter converts above, pages with a navigation menu | 2.69% |
| Top tenth converts above, pages with a navigation menu | 8.4% |
| Median form conversion rate, pages with testimonials | 1.33% |
| Median form conversion rate, pages without testimonials | 2.4% |
| Median form conversion rate, pages with a video | 0.75% |
| Median form conversion rate, pages without a video | 2.63% |
| Median form conversion rate, all pages | 1.96% |
Median form conversion rate, pages without a navigation menu
Bottom quarter converts below, pages without a navigation menu
Top quarter converts above, pages without a navigation menu
Top tenth converts above, pages without a navigation menu
Median form conversion rate, pages with a navigation menu
Bottom quarter converts below, pages with a navigation menu
Top quarter converts above, pages with a navigation menu
Top tenth converts above, pages with a navigation menu
Median form conversion rate, pages with testimonials
Median form conversion rate, pages without testimonials
Median form conversion rate, pages with a video
Median form conversion rate, pages without a video
Median form conversion rate, all pages
Based on more than 5,700 published pages. As of November 17, 2026.
The short answer: median rates for common landing page elements
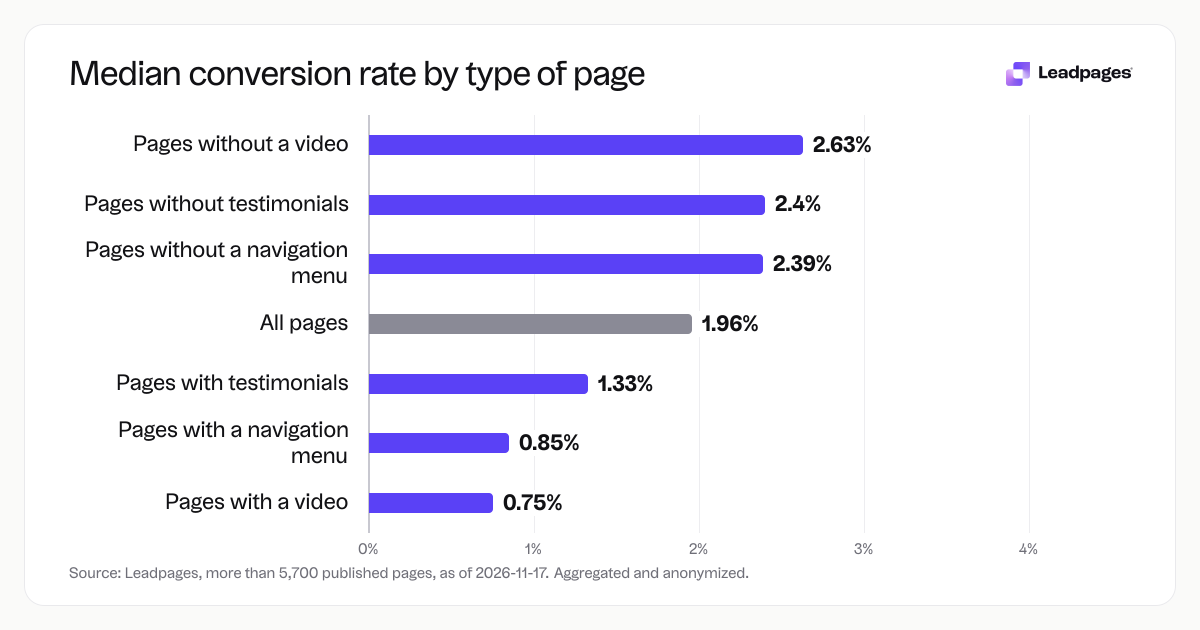
Compare pages by the elements they include and some clear patterns show up. The figures below are medians across thousands of real pages over the 90 days ending November 16, 2026.
- All pages: median form conversion rate of 1.96%
- Without a navigation menu: 2.39% median
- With a navigation menu: 0.85% median
- With testimonials: 1.33% median
- Without testimonials: 2.4% median
- With a video: 0.75% median
- Without a video: 2.63% median
These numbers do not say that adding or removing a nav bar, video, or testimonial causes a rate to rise or fall. They describe the pages as they were. Pages with navigation often serve several goals, which can dilute form submissions. Video can add a step before the form. Still, many high performers include these elements and convert well. Treat the medians as a reference, not a rule.
How the rates break down: spreads and outliers
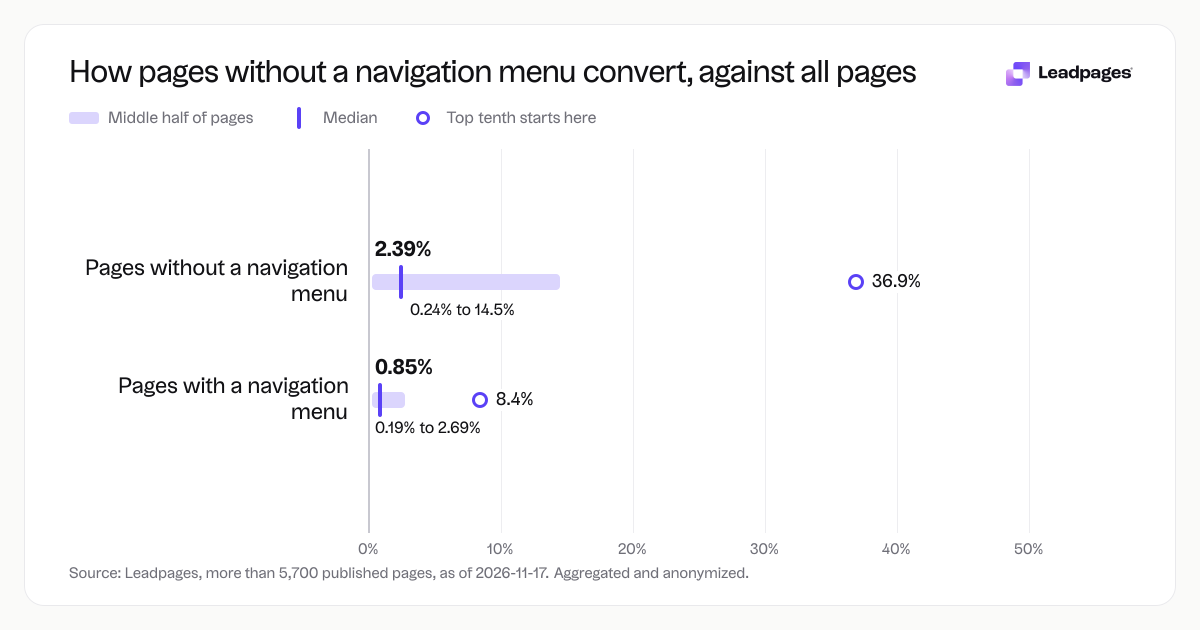
A median hides how wide the range can be. For pages without a navigation menu, the bottom quarter converted below 0.24%. That set likely includes pages with very little traffic or weak offers. The top quarter converted above 14.5%, and the top tenth above 36.9%. Those pages tend to pair a strong offer, clear copy, and a simple form.
Pages with a navigation menu show a tighter spread but the same upward tail. The bottom quarter is below 0.19%. The top quarter is above 2.69%, and the top tenth above 8.4%. So pages that keep a full site header can still convert several times higher than the median.
This spread shows the design element alone is not destiny. A page with a nav bar can convert at 8.4% or higher in the right context. A page without one can still land in the bottom 0.24% if the rest of the page is weak. The same goes for video and testimonials. The median for pages with testimonials (1.33%) is lower than for pages without (2.4%), but that does not tell you to delete client quotes. It suggests that dropping a testimonial block on the page, without testing placement and copy, does not guarantee a lift.
What the top quarter of pages does differently
We cannot tell which elements caused higher conversions, but we can describe the cohort. Among pages without navigation, the top quarter sat above 14.5%. Many of these pages focus on a single offer: a free estimate for a home service, a downloadable checklist for a marketing consultant, a demo request for a SaaS tool. They remove links that send visitors elsewhere. The headline matches the ad or email, the form is short, and the button sets a clear next step.
Pages with navigation that reached the top tenth (above 8.4%) often appear where trust and supporting content matter. A financial advisor might keep the main menu so visitors can check credentials, yet still convert at a strong rate because the offer is valuable and the form is visible. A product trial page from a known brand may include nav without hurting intent.
Video and testimonials also show up in top performers. A coaching business might place a short client video under the headline, and the page still converts well because the video replaces a long explanation. The difference is that the video is made for the landing page and answers a specific question, not a generic brand reel.
The takeaway is to judge the page as a complete message. What matters is that the page answers the visitor’s question fast, avoids distractions, and makes the next step obvious.
How to put these benchmarks to use on your own pages
A broad median gives you a reference point. Your goal decides what good looks like. A free newsletter signup should convert higher than a paid consultation booking. A webinar registration tied to a LinkedIn ad may sit lower because the audience is cold.
Start by measuring your form conversion rate over a 90-day window. Compare it with medians for similar pages. If your page has a nav menu, the median for those pages is 0.85%. If you are above 2.69%, you are in the top quarter. If you are below 0.19%, you have room to grow.
Once you have a baseline, change one element at a time and measure the result. A free A/B test calculator can tell you when a difference is reliable. For example, test removing the navigation menu on a dedicated PPC landing page and compare form submissions over a few weeks. Or move testimonials closer to the form and see if that helps, instead of leaving them at the bottom.
Even a modest improvement in conversion rate can double your leads without more traffic.
How we measured these conversion rates
We looked at more than 5,700 landing pages published with Leadpages. The data is aggregated and anonymized, covering a 90-day window that ended November 16, 2026. A form conversion rate is the share of visits to a page in which the visitor submitted its form. Every figure in this report is a median or quartile across the pages in a group.
We grouped pages by whether they included a navigation menu, testimonials, or a video at any point during the period. The groups are not mutually exclusive. A page with both a nav menu and a video appears in both the “with nav” and “with video” medians. That overlap can affect the differences you see but does not make the medians less real. They reflect what the typical page in each group experienced.
Because the data is descriptive, it does not control for industry, traffic source, offer type, or design quality. That is why the top quarter figures matter alongside the medians. They show that every element group has high performers.
To see how your page measures up, run it through the free landing page analyzer.