
Landing page benchmarks
Landing Page Testimonials Conversion Rate: Benchmarks from 5,700+ Pages
Real conversion rate data for landing pages with testimonials vs. without. Median, top quarter, and top tenth benchmarks from 5,700+ pages.
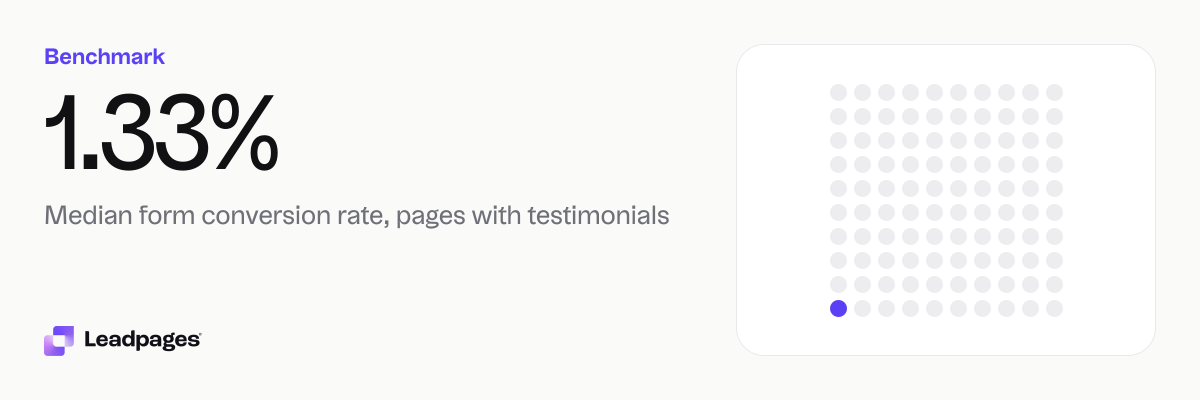
Across landing pages published with Leadpages over a recent 90-day period, pages that included at least one testimonial had a median form conversion rate of 1.33%. Pages without testimonials had a median of 2.4%. The gap does not mean testimonials reduce sign-ups. It likely reflects the offers and audiences those pages attract.
Leadpages data
Form conversion rates for pages published with Leadpages, with and without testimonials, over the 90 days to 2026-11-16. A form conversion rate is the share of visits to a page in which the visitor submitted its form. Each figure is a median or quartile across pages. It describes the pages in a group, not what causes the difference between groups.
more than 5,700 published pagesAs of November 17, 2026
1.33%
Median form conversion rate, pages with testimonials
0.13%
Bottom quarter converts below, pages with testimonials
4.4%
Top quarter converts above, pages with testimonials
| Measure | Value |
|---|---|
| Median form conversion rate, pages with testimonials | 1.33% |
| Bottom quarter converts below, pages with testimonials | 0.13% |
| Top quarter converts above, pages with testimonials | 4.4% |
| Top tenth converts above, pages with testimonials | 15.3% |
| Median form conversion rate, pages without testimonials | 2.4% |
| Bottom quarter converts below, pages without testimonials | 0.26% |
| Top quarter converts above, pages without testimonials | 16.7% |
| Top tenth converts above, pages without testimonials | 40.1% |
| Median form conversion rate, pages with trust badges | 1.31% |
| Median form conversion rate, pages without trust badges | 2.56% |
| Median form conversion rate, all pages | 1.96% |
Median form conversion rate, pages with testimonials
Bottom quarter converts below, pages with testimonials
Top quarter converts above, pages with testimonials
Top tenth converts above, pages with testimonials
Median form conversion rate, pages without testimonials
Bottom quarter converts below, pages without testimonials
Top quarter converts above, pages without testimonials
Top tenth converts above, pages without testimonials
Median form conversion rate, pages with trust badges
Median form conversion rate, pages without trust badges
Median form conversion rate, all pages
Based on more than 5,700 published pages. As of November 17, 2026.
The short answer: conversion rates with and without testimonials
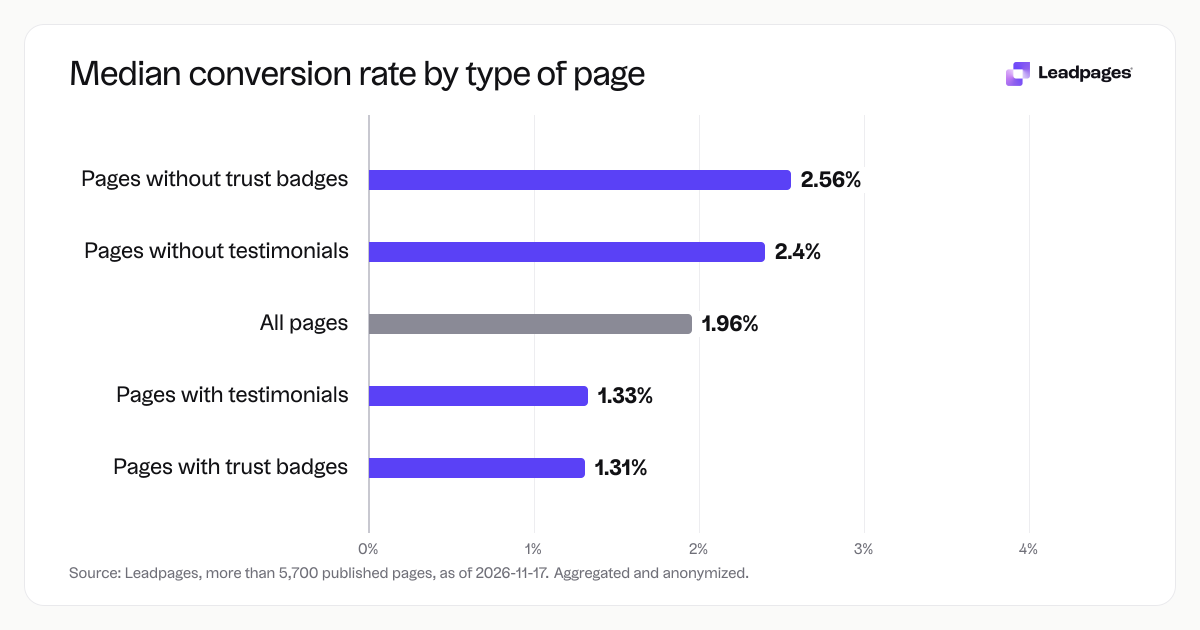
Looking at more than 5,700 published landing pages, pages that use customer testimonials show a lower median form conversion rate than pages that don’t. The numbers:
- Median form conversion rate, pages with testimonials: 1.33%
- Median form conversion rate, pages without testimonials: 2.4%
- Median, all pages in the sample: 1.96%
Trust badges show a similar pattern. Pages that include a trust badge had a median conversion of 1.31%, while those without one came in at 2.56%. In both cases, pages with a trust signal cluster lower in the distribution.
This is not evidence that testimonials or trust badges hurt conversion. It is a snapshot of which pages tend to use them. Often, a business adds testimonials when the decision is larger, the cost is higher, or the audience needs more reassurance. A consulting firm pitching a custom service might use client quotes and still see a 1.33% conversion rate as a win. A free checklist giveaway without testimonials can convert far more visits because the commitment is small.
How the numbers break down: distribution of both groups
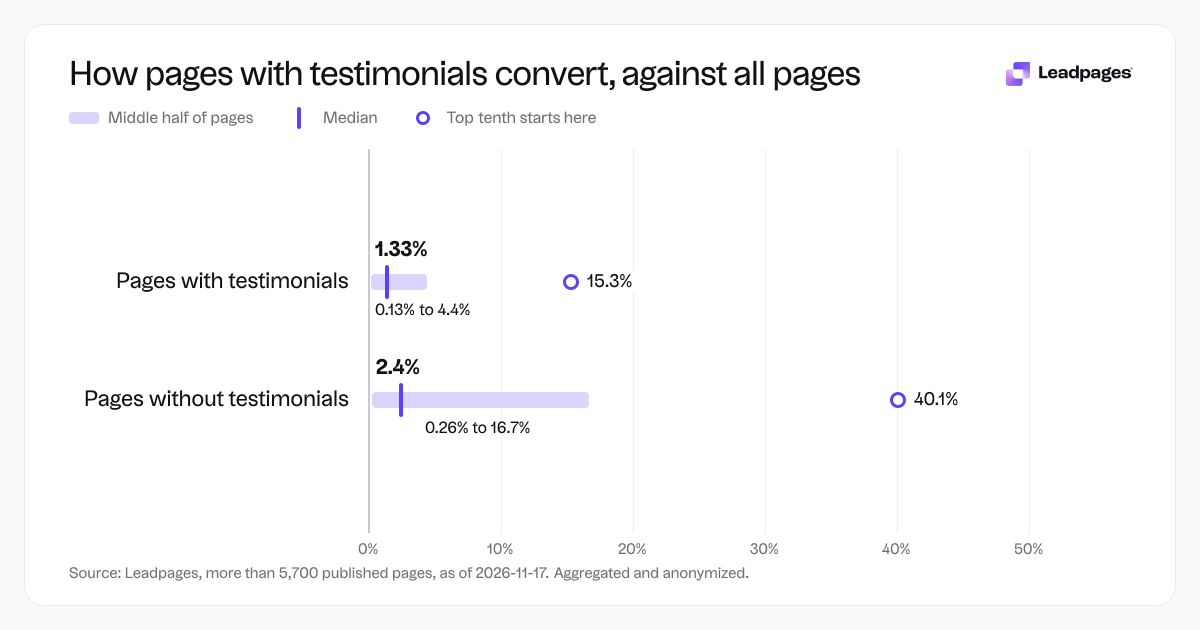
Medians give a midpoint, but the spread matters too. Here is how the pages in each group distribute across quartiles and deciles.
Pages with testimonials:
- Bottom quarter converts below: 0.13%
- Top quarter converts above: 4.4%
- Top tenth converts above: 15.3%
Pages without testimonials:
- Bottom quarter converts below: 0.26%
- Top quarter converts above: 16.7%
- Top tenth converts above: 40.1%
The range inside each group is wide. A page with testimonials can sit near the bottom of the range or rise above the top tenth. That tells you testimonials do not define performance. The offer, the form length, the headline, the traffic source, and how well the page matches visitor intent all stack up to move a page up or down.
For pages without testimonials, the top tenth crosses 40.1%. Many of these are likely simple lead magnets with a single email field: a short ebook download, a template, a free tool sign-up. The bottom quarter below 0.26% might be pages with long forms, weak calls to action, or traffic that does not match the message on the page.
If you run a service business and a 15.3% top-tenth figure for testimonial pages looks appealing, remember that the same group’s bottom quarter sits under 0.13%. Your page could be anywhere on that curve, and small changes can shift it.
What the top quarter does differently
We cannot trace exact causes from this data alone. The figures describe the pages in a group, not why one page converts at 4.4% and another at 0.13%. But across the thousands of pages we see, a few patterns show up for top-quartile performers in either group.
- They match the promise the visitor clicked. If an ad or email says “get the pricing guide,” the headline and hero copy on the landing page say “pricing guide.” No friction, no surprise. You can check your own page with our free headline analyzer to spot mismatches.
- The form is as short as it can be. Pages that ask for name, email, phone, company size, and role in one lump rarely land in the top quarter. A contact form for a high-ticket service might still need a few fields, but top pages keep it to the essentials and explain why each field is needed.
- The call to action is specific. Instead of “Submit,” the button might say “Get the checklist” or “Book my call.” Small wording changes show up in button copy experiments. You can run your own tests with Leadpages A/B testing and use our A/B test calculator to know when a result is reliable.
Here is a concrete example. A SaaS company offering a demo lands in the top quarter for a page with testimonials if the page has a tight headline, two client quotes, a three-field form, and a CTA that says “See it in action.” The same company with a generic “Learn more” button and a testimonial buried at the bottom might sit near the median or lower. Meanwhile, a health coach’s lead magnet page without testimonials (a free meal plan, one email field) can land in the top tenth above 40.1%.
The goal is steady testing and iteration. Use the landing page analyzer to get a score that highlights where your page could improve, then test one change at a time.
How to read your own number
Treat your conversion rate and these benchmarks as a starting point, not a final grade.
If your page with testimonials converts above the median but still falls short of the top-quarter mark, you might test a shorter form or a clearer offer. A page without testimonials that converts at a solid rate yet misses the 16.7% top-quarter threshold still has room to improve.
Context changes what “good” means. A real estate agent’s “home valuation” page with testimonials might convert well at a low single-digit rate because each lead can carry high value to the business. A free email course page without testimonials might convert at a high rate and still need work if most of those leads never open the emails.
Instead of chasing one benchmark, track your own conversion rate over time. Make a change, wait for enough visitors, and note the direction. Use the A/B test calculator to decide if the lift is real. Compare your page against the group that matches your approach (testimonials or not), but treat the number as a pointer, not a verdict.
If you want a quicker read on where your page stands, the landing page analyzer scores key elements like messaging, form design, and mobile experience. It is a free tool built on what we have seen work across high-performing pages.
How we measured this
The data comes from form conversion rates on more than 5,700 pages published through Leadpages over the 90-day period ending 2026-11-16. A form conversion rate is the share of visits to a page in which the visitor submitted its form.
All pages in the sample were aggregated and anonymized. No individual page, business, or visitor can be identified. Every figure is a median, a quartile, or a decile across pages. A median of 1.33% for pages with testimonials means half of those pages converted at or below that rate, and half converted above it. The bottom quarter threshold of 0.13% means the lowest-performing quarter of pages with testimonials converted at or below that number, while the top quarter above 4.4% captures the highest-performing quarter.
We also split the sample by the presence of trust badges and by the presence of testimonials. The same methodology applies. The all-pages median of 1.96% includes every page regardless of trust elements.
Remember that these figures describe the pages in a group. They do not name a cause. A page’s conversion rate reflects its offer, audience, traffic source, copy, design, and timing. Use the benchmarks as a reference, then test your way up.