
Landing page benchmarks
Landing Page Video Conversion Rate: What the Data Shows
Data from 5,700+ Leadpages landing pages: median form conversion rate for pages with video was 0.75%, vs 2.63% without. See the full breakdown and how to improve.
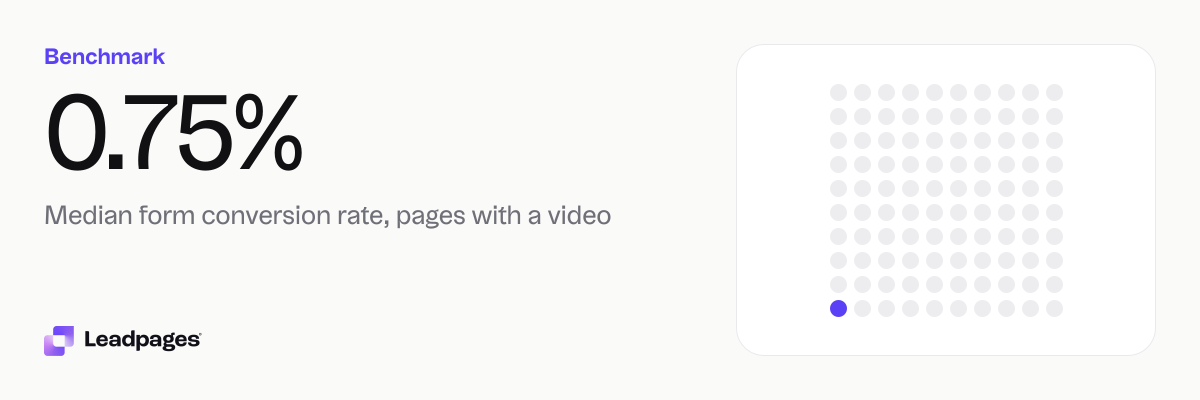
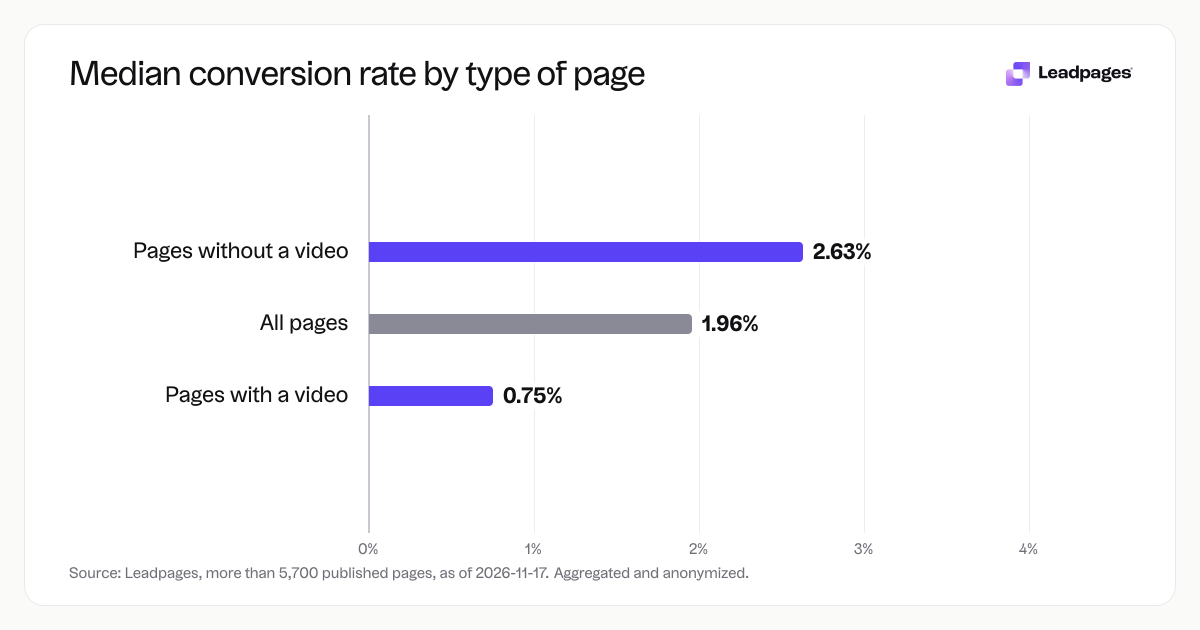
Across landing pages published with Leadpages, the median form conversion rate for pages that include a video is 0.75%. For pages without a video, the median rate is 2.63%. Adding a video does not automatically lift conversions. How you use video matters more than having one.
Leadpages data
Form conversion rates for pages published with Leadpages, with and without video, over the 90 days to 2026-11-16. A form conversion rate is the share of visits to a page in which the visitor submitted its form. Each figure is a median or quartile across pages. It describes the pages in a group, not what causes the difference between groups.
more than 5,700 published pagesAs of November 17, 2026
0.75%
Median form conversion rate, pages with a video
0%
Bottom quarter converts below, pages with a video
2.96%
Top quarter converts above, pages with a video
| Measure | Value |
|---|---|
| Median form conversion rate, pages with a video | 0.75% |
| Bottom quarter converts below, pages with a video | 0% |
| Top quarter converts above, pages with a video | 2.96% |
| Top tenth converts above, pages with a video | 10.5% |
| Median form conversion rate, pages without a video | 2.63% |
| Bottom quarter converts below, pages without a video | 0.34% |
| Top quarter converts above, pages without a video | 16.2% |
| Top tenth converts above, pages without a video | 38.4% |
| Median form conversion rate, all pages | 1.96% |
Median form conversion rate, pages with a video
Bottom quarter converts below, pages with a video
Top quarter converts above, pages with a video
Top tenth converts above, pages with a video
Median form conversion rate, pages without a video
Bottom quarter converts below, pages without a video
Top quarter converts above, pages without a video
Top tenth converts above, pages without a video
Median form conversion rate, all pages
Based on more than 5,700 published pages. As of November 17, 2026.
The short answer: video and conversion rates
Most landing pages with video convert at a lower rate than pages that skip video. The median video page sees fewer than one form submission per 100 visits, while the median page without video collects more than two and a half submissions per 100 visits. That gap shows up across the ranges we looked at.
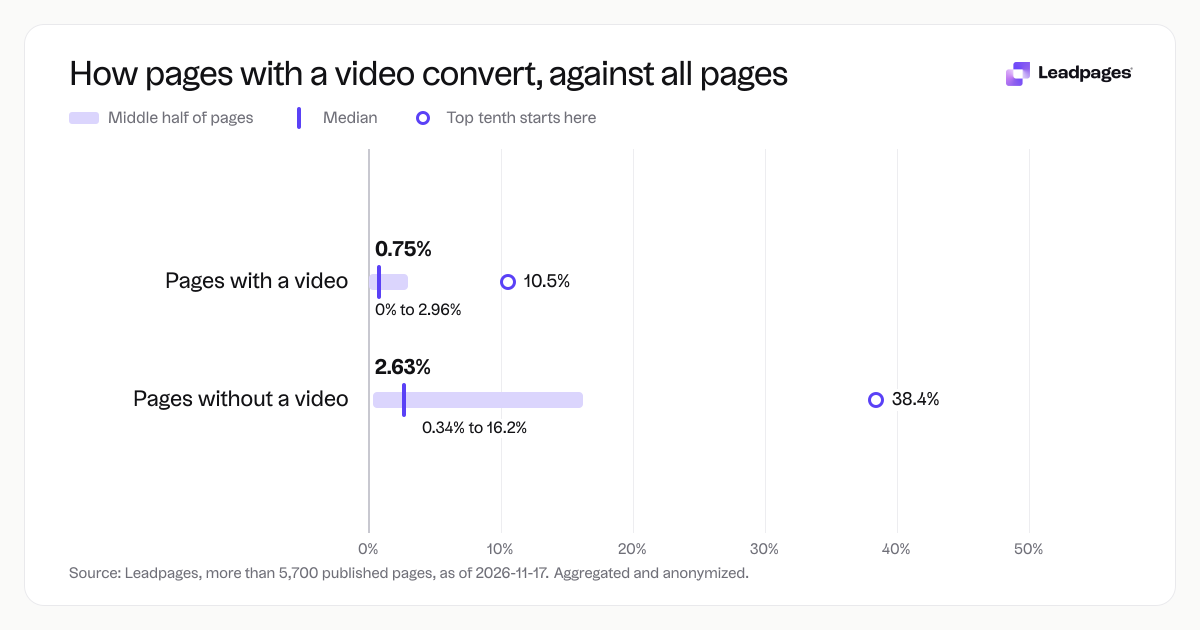
A strong video page can still perform. The top quarter of video pages converts above 2.96%, and the top tenth converts above 10.5%. The top tenth of pages without video reaches 38.4%. Treat video as a tool. Use it with intent.
How the numbers break down: video vs. no video
We grouped more than 5,700 published Leadpages landing pages by whether they used at least one video on the page. Then we looked at the median, bottom quartile, top quartile and top tenth for form conversion rate (the share of visits where a visitor submitted the form). Here is what we found.
All pages together
- Median form conversion rate: 1.96%
Pages without a video
- Median: 2.63%
- Bottom quarter: converts below 0.34%
- Top quarter: converts above 16.2%
- Top tenth: converts above 38.4%
Pages with a video
- Median: 0.75%
- Bottom quarter: converts below 0% (one in four video pages saw zero form submissions)
- Top quarter: converts above 2.96%
- Top tenth: converts above 10.5%
The difference in medians is large. Typical video pages convert far below typical non-video pages. And while the top non-video pages can turn a large share of visitors into leads, even the best video pages do not reach that level. Video is not a quick fix.
What the top-performing video pages get right
We cannot see exactly why the top video pages outperform the rest, but the data points toward a few habits that convert. Pages in the top tenth (above 10.5%) tend to use video as supporting evidence, not the main event.
- The call to action stays visible before and after the video. The form is usually above the fold.
- The video is short, often under 60 seconds, and shows the product in use or a real customer outcome. It does not start with a long logo animation or generic welcome.
- Autoplay is off. The visitor chooses to watch.
- The page is simple. The video sits close to the form, and the headline and a few bullet points make the offer clear, even if the visitor never presses play.
These pages also get tested. Many of the top video pages likely ran an A/B test that compared a video version against a static version, and the video version won because the video answered a real question the audience had. If you are considering video, test it against a page without video before you commit. And read our practical guide on how to use video on landing pages without hurting conversions.
The bottom quarter of video pages, which saw no form submissions at all, may signal common mistakes: full-page video backgrounds that hide the form, auto-playing sound that annoys mobile visitors, or a video that is too long and pushes the form several scrolls down the page.
How to read your own landing page’s conversion rate
A benchmark is a starting point, not a target. If your landing page with video converts at a rate that's above the median for video pages but still below the median for pages without video, you have room to grow. Instead of chasing an industry number, set your own baseline and improve it.
First, get an unbiased read on your page. Use our free landing page analyzer. It scores your page against practices drawn from thousands of real pages and gives you a list of high-impact changes you can make today.
Then, look at how your conversion rate behaves for different traffic sources. A page that draws mostly paid search traffic might convert differently than one fed by a social media ad with a video thumbnail. Leadpages analytics can show you conversion rate by device and by UTM source, so you can spot whether your video page drops on mobile but works on desktop.
Finally, remember that a form conversion rate is one signal. If video brings fewer form fills but the leads are more qualified and close at a higher rate, the page might still be the better business decision. Pair conversion data with feedback from sales or customer calls.
How we measured this
The numbers come from more than 5,700 landing pages published with Leadpages, aggregated and anonymised. We looked at pages that were active during the 90-day window ending 16 November 2026.
For each page, we measured the form conversion rate: the number of visits in which the visitor submitted the page’s form, divided by total visits. We then split the pages into two groups (those that contained at least one video element, and those that contained none) and calculated the median, bottom quartile, top quartile and top tenth for each group.
These are descriptive statistics. They show what typical performance looked like in our sample, not why one group converted differently than the other. The groups are not matched for offer type, industry, traffic source or page layout. Any comparison between them reflects the mix of real-world pages that our customers published, not a controlled experiment.
If you want to see how your own landing page stacks up, start with a free landing page score and a list of actionable improvements.